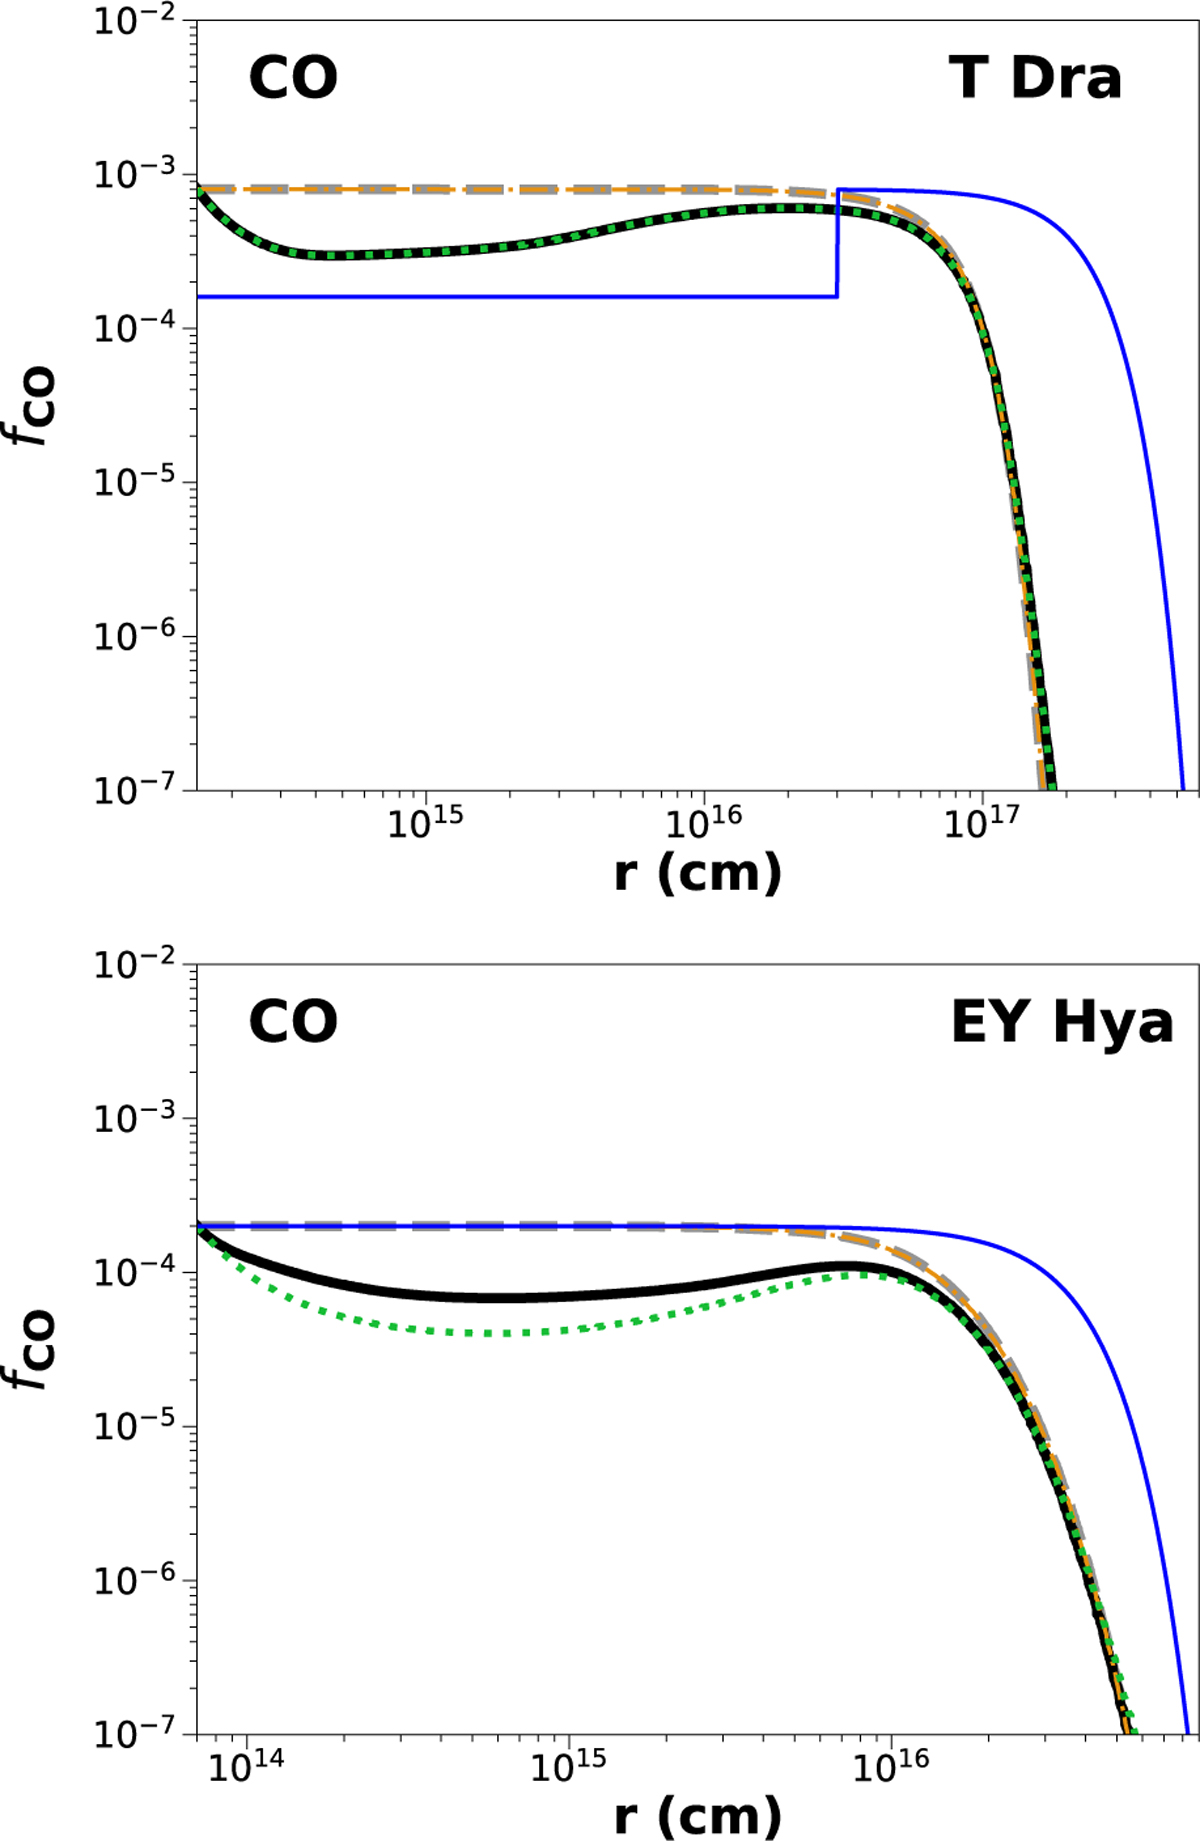
Fig. 7
Download original image
Comparison between chemical kinetics model predictions (Sect. 6) and the CO radial abundance distributions from our line radiative transfer analysis (Sect. 5.1) for the two X-AGBs: TDra (top) and EY Hya (bottom). The black solid line represents ‘model-uv/x’, the green dotted line represents ‘model-x’, the grey dashed line represents ‘model-std’, the orange dash-dotted line represents ‘model-uv’. The blue solid line shows the derived CO radial abundance distribution from the radiative transfer modelling of the observed CO lines.
Current usage metrics show cumulative count of Article Views (full-text article views including HTML views, PDF and ePub downloads, according to the available data) and Abstracts Views on Vision4Press platform.
Data correspond to usage on the plateform after 2015. The current usage metrics is available 48-96 hours after online publication and is updated daily on week days.
Initial download of the metrics may take a while.