Fig. 5
Download original image
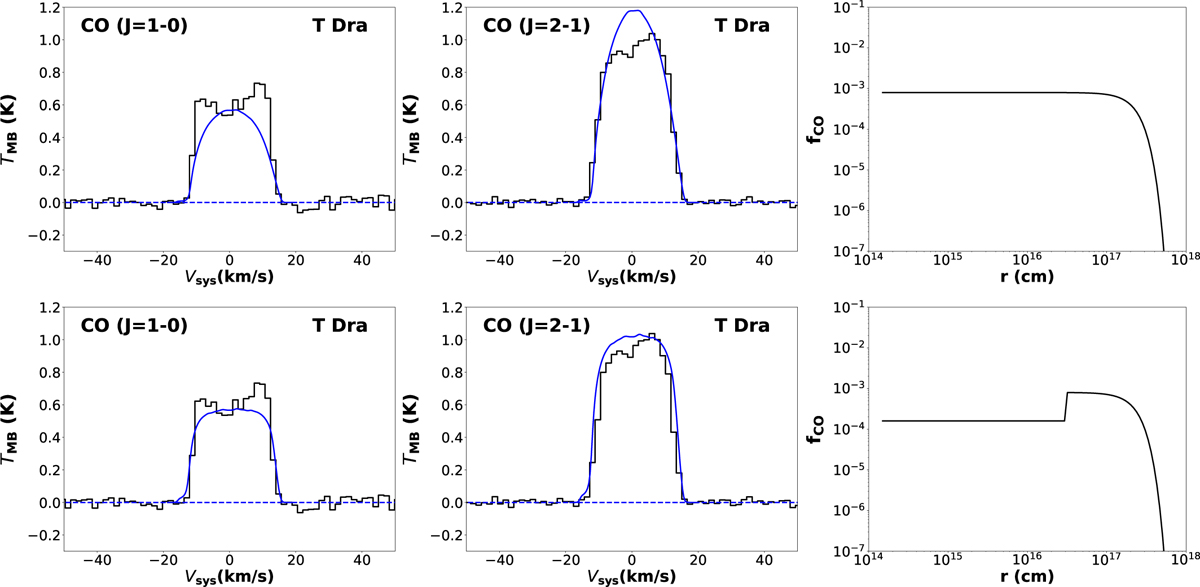
Model (a) assuming the standard CO radial abundance (top) and model (b) assuming a centrally depleted CO radial abundance likely caused by an enhanced CO dissociation driven by X-ray radiation (bottom). 12CO (J=1-0) (left) and 12CO (J=2-1) (middle) observed and synthetic spectra in the C-rich X-AGB T Dra. Observed spectra are shown in black (velocity resolution is δv=1.6 km s−1). Synthetic spectra are shown in blue. Right panels: the different adopted CO abundance profiles for each model. As discussed in Sect. 5, model (b) fits the line shapes better than model (a).
Current usage metrics show cumulative count of Article Views (full-text article views including HTML views, PDF and ePub downloads, according to the available data) and Abstracts Views on Vision4Press platform.
Data correspond to usage on the plateform after 2015. The current usage metrics is available 48-96 hours after online publication and is updated daily on week days.
Initial download of the metrics may take a while.