Fig. B.2
Download original image
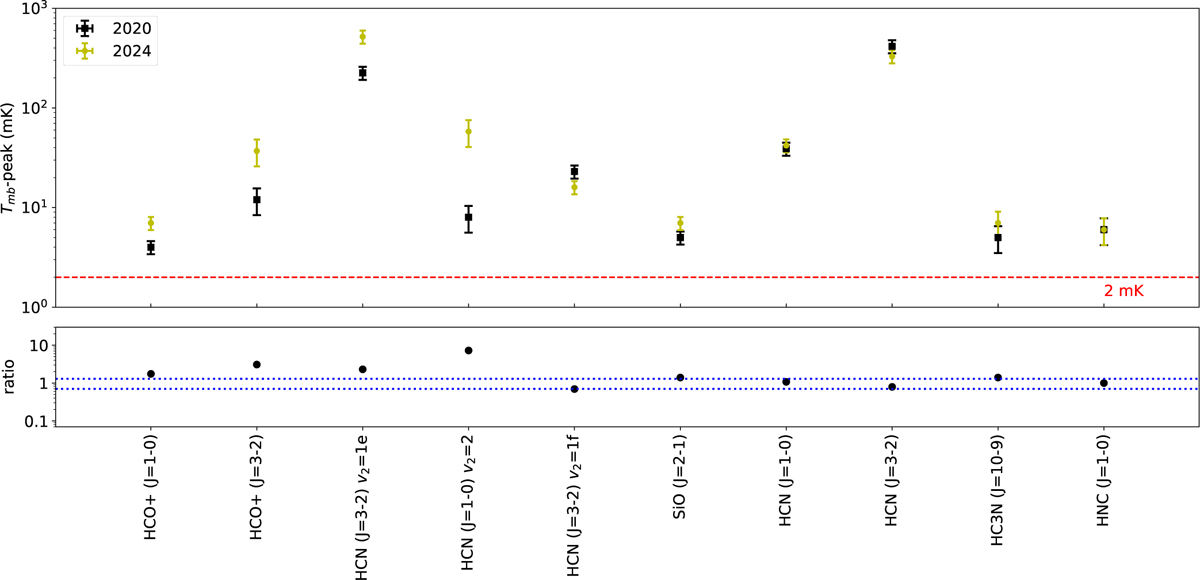
Comparison between the main beam peak temperatures for the lines observed for TDra in the two observational campaigns. Upper: main beam peak temperatures of the lines, 2020 observations are shown in black and 2024 observations are shown in yellow. Bottom: Ratio between the 2024 and the 2020 main beam peak temperatures, blue dotted lines indicate the 1.3 and 0.7 range. It is shown that HCO+ and HCN maser lines show significant variability.
Current usage metrics show cumulative count of Article Views (full-text article views including HTML views, PDF and ePub downloads, according to the available data) and Abstracts Views on Vision4Press platform.
Data correspond to usage on the plateform after 2015. The current usage metrics is available 48-96 hours after online publication and is updated daily on week days.
Initial download of the metrics may take a while.