Open Access
Fig. B.1
Download original image
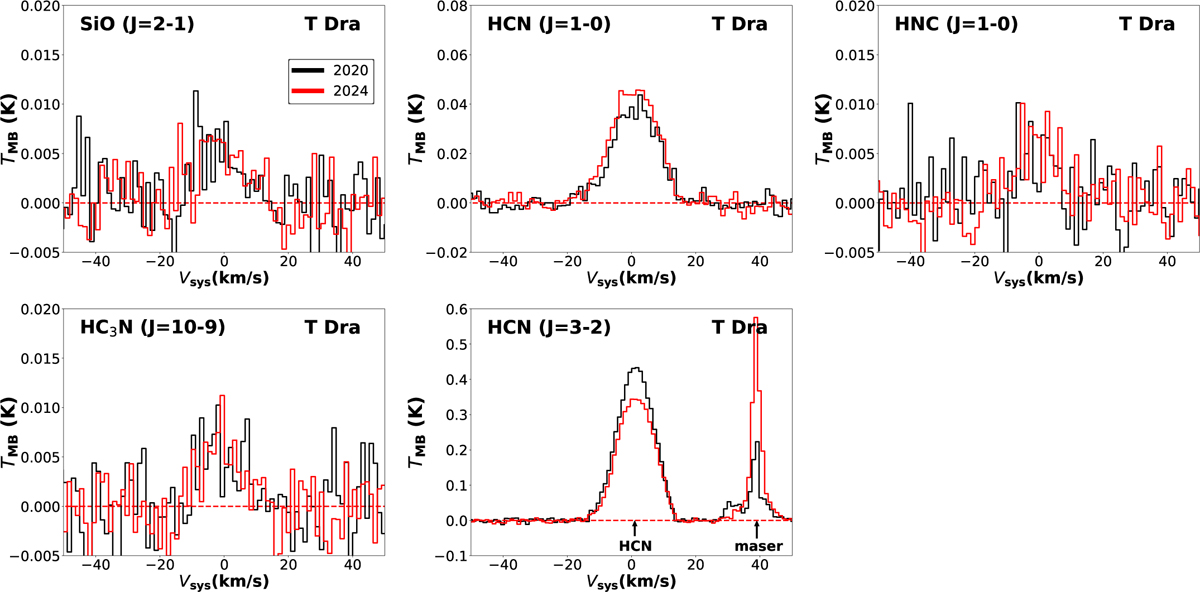
Multi-epoch spectra of the rest of lines in T Dra. Observed spectra are shown in black for 2020 observations and in red for 2024 observations (velocity resolution is δv=1.4kms−1). No significant differences were found between the observed epochs for these lines considering flux calibration errors.
Current usage metrics show cumulative count of Article Views (full-text article views including HTML views, PDF and ePub downloads, according to the available data) and Abstracts Views on Vision4Press platform.
Data correspond to usage on the plateform after 2015. The current usage metrics is available 48-96 hours after online publication and is updated daily on week days.
Initial download of the metrics may take a while.