Fig. 11
Download original image
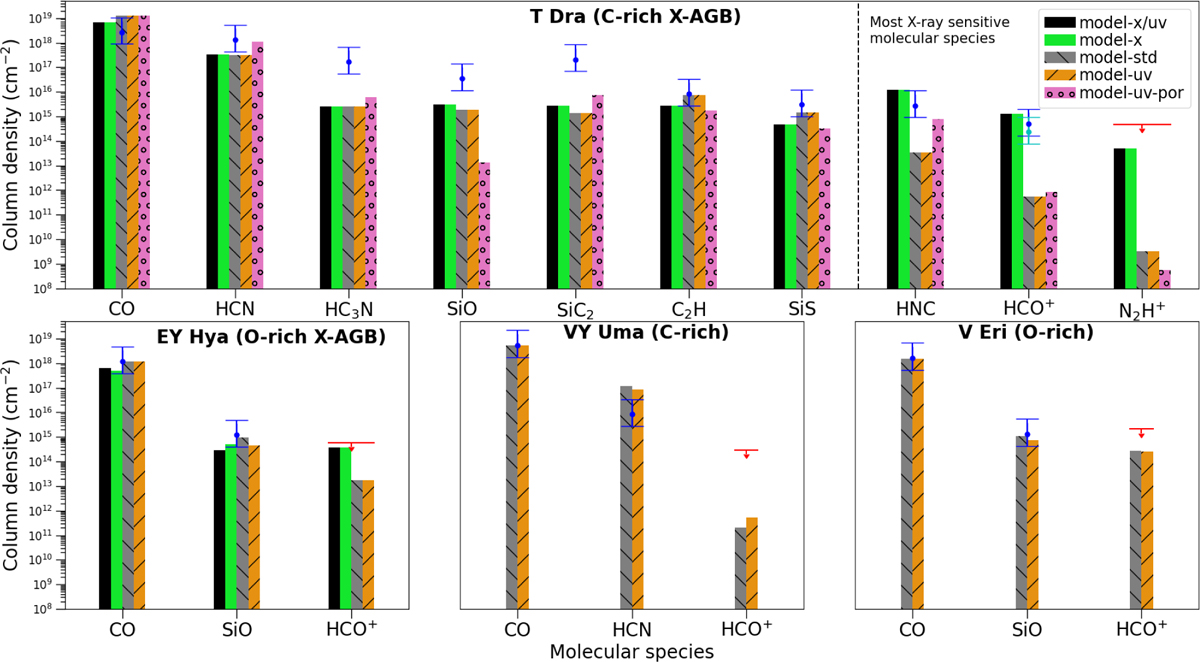
Column densities estimated from our radiative transfer models (values and upper limits represented by segments and arrows respectively) compared with those predicted by our chemical kinetics models (represented by the bars) for different species and targets explored in this work (see Sects. 5 and 6). The blue and cyan segments represent detections obtained in 2020 and 2024, respectively; red arrows indicate upper limits. The size of the segments correspond to column density uncertainties of a factor of three. The black solid bar represents ‘model-x/uv’, the green solid bar represents ‘model-x’, the grey striped bar represents ‘model-std’, the orange striped bar represents ‘model-uv’ and the pink ringed bar represents ‘model-uv’ when considering a porous envelope (‘model-uv-por’).
Current usage metrics show cumulative count of Article Views (full-text article views including HTML views, PDF and ePub downloads, according to the available data) and Abstracts Views on Vision4Press platform.
Data correspond to usage on the plateform after 2015. The current usage metrics is available 48-96 hours after online publication and is updated daily on week days.
Initial download of the metrics may take a while.