Fig. 10
Download original image
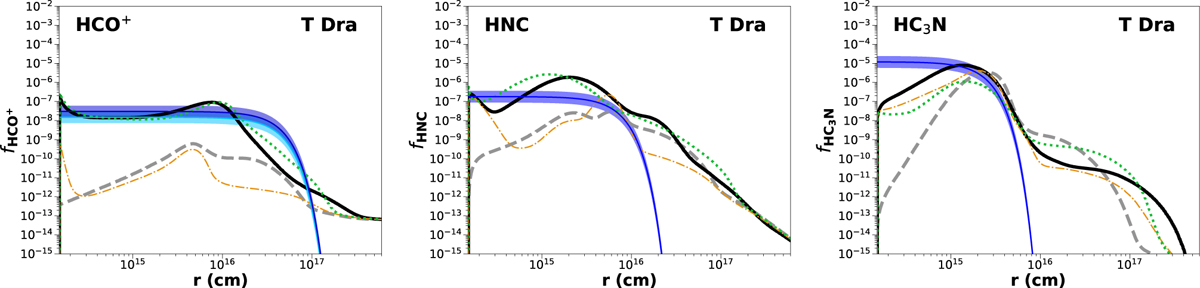
Comparison between the chemical kinetics model predictions and the empirically estimated abundances (see Table 3) for T Dra considering the case of a porous envelope. The black solid line represents ‘model-uv/x’, the green dotted line represents ‘model-x’, the grey dashed line represents ‘model-std’, the orange dash-dotted line represents ‘model-uv’. The blue solid lines shows the empirical estimations (HCO+ has a dark blue line for 2020 observation and a light blue line for 2024 observations), and the shadowed areas indicate a factor 2 for the uncertainties in the empirical abundances estimations.
Current usage metrics show cumulative count of Article Views (full-text article views including HTML views, PDF and ePub downloads, according to the available data) and Abstracts Views on Vision4Press platform.
Data correspond to usage on the plateform after 2015. The current usage metrics is available 48-96 hours after online publication and is updated daily on week days.
Initial download of the metrics may take a while.