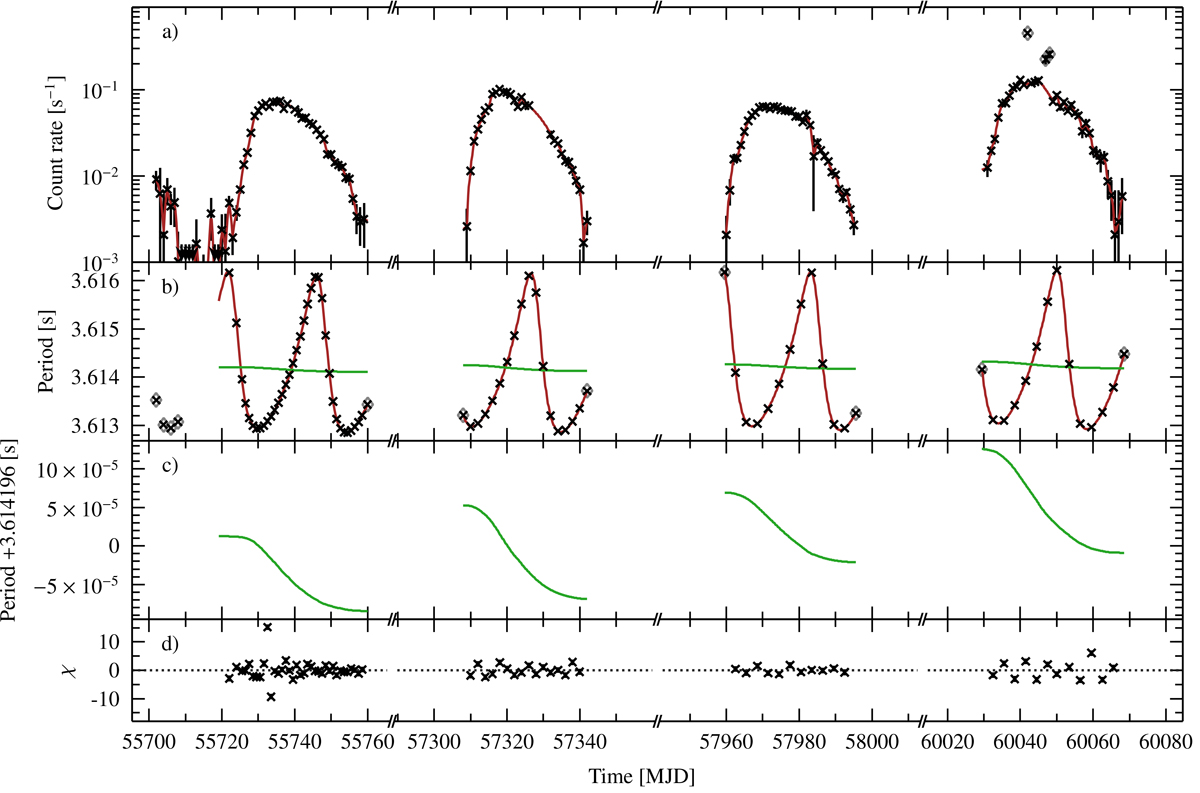
Fig. 7.
Download original image
Torque modeling for 4U 0115+63. (a) Light curve of 4U 0115+63 as measured by Swift/BAT. The red curve is the interpolation of the data. (b) Pulsation period as measured by Fermi/GBM. The red curve is the best-fit model of WIII modified by the Doppler shift of the orbit. The green curve is the intrinsic spin-up of the NS. (c) Intrinsic spin-up signal predicted by the model (same as the green curve in panel (b). (d) χ residuals of the spin model. For all panels, the crosses enclosed by gray diamonds have been ignored for the model comparison; we also note the gaps on the time axis.
Current usage metrics show cumulative count of Article Views (full-text article views including HTML views, PDF and ePub downloads, according to the available data) and Abstracts Views on Vision4Press platform.
Data correspond to usage on the plateform after 2015. The current usage metrics is available 48-96 hours after online publication and is updated daily on week days.
Initial download of the metrics may take a while.