Open Access
Fig. 6.
Download original image
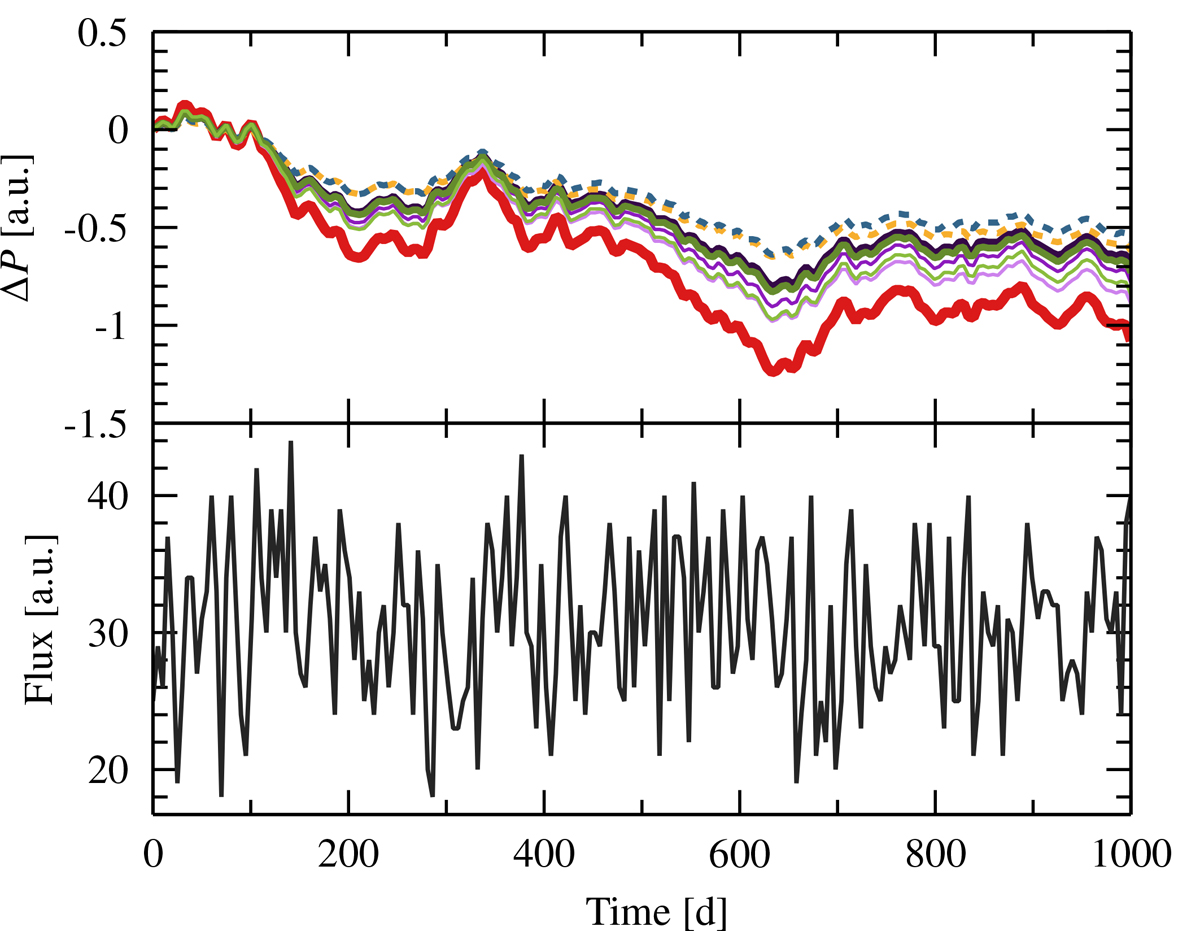
Top panel: Predicted change in rotation period for all models (except Rappaport et al. 2004) for a given starting period and a mass accretion rate defined by a Poisson process. The colors indicate the models, as before. The dashed lines indicate models with Rt∝RA. Bottom panel: Simulated Poisson light curve.
Current usage metrics show cumulative count of Article Views (full-text article views including HTML views, PDF and ePub downloads, according to the available data) and Abstracts Views on Vision4Press platform.
Data correspond to usage on the plateform after 2015. The current usage metrics is available 48-96 hours after online publication and is updated daily on week days.
Initial download of the metrics may take a while.