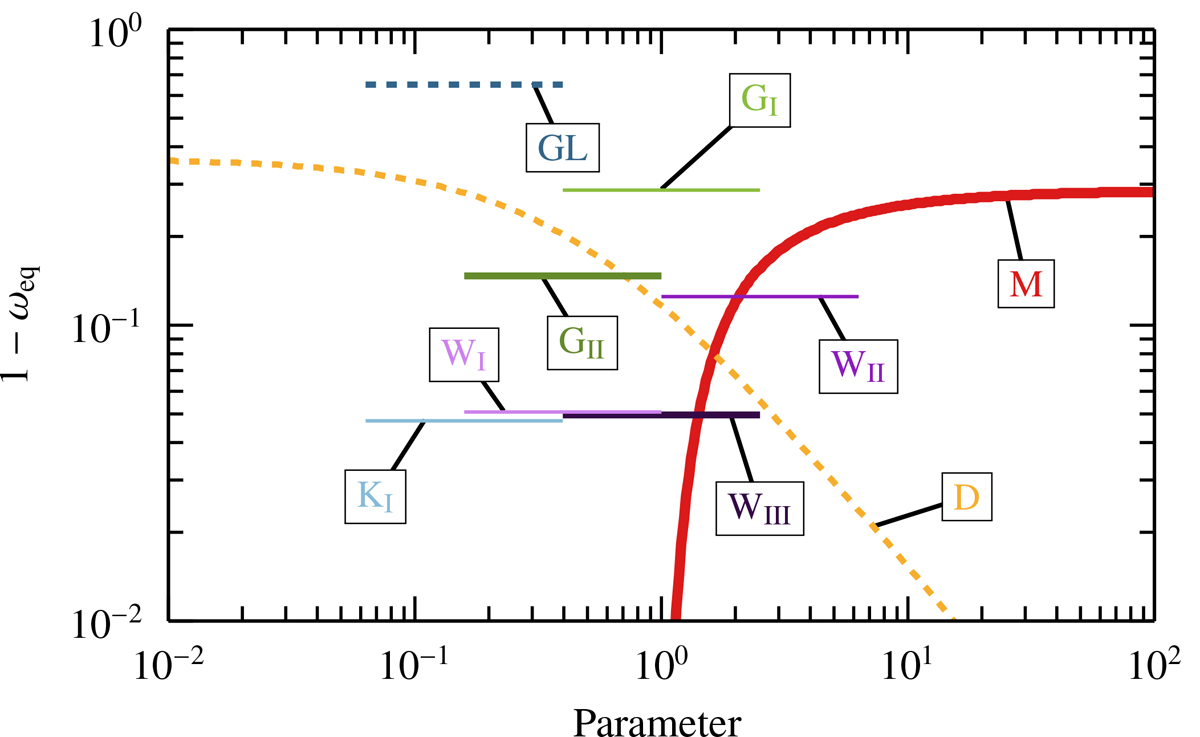
Fig. 5.
Download original image
Visual representation of the equilibrium fastness. The parameter is either ωp for Matt & Pudritz (2005) or ξ/γc for Dai & Li (2006). For ωp the lower bound is 1. All other models have fixed values for the equilibrium fastness (see Table 2) and are displayed over an arbitrary short range for clarity only. The dashed lines indicate models where Rt∝RA.
Current usage metrics show cumulative count of Article Views (full-text article views including HTML views, PDF and ePub downloads, according to the available data) and Abstracts Views on Vision4Press platform.
Data correspond to usage on the plateform after 2015. The current usage metrics is available 48-96 hours after online publication and is updated daily on week days.
Initial download of the metrics may take a while.