Fig. 9
Download original image
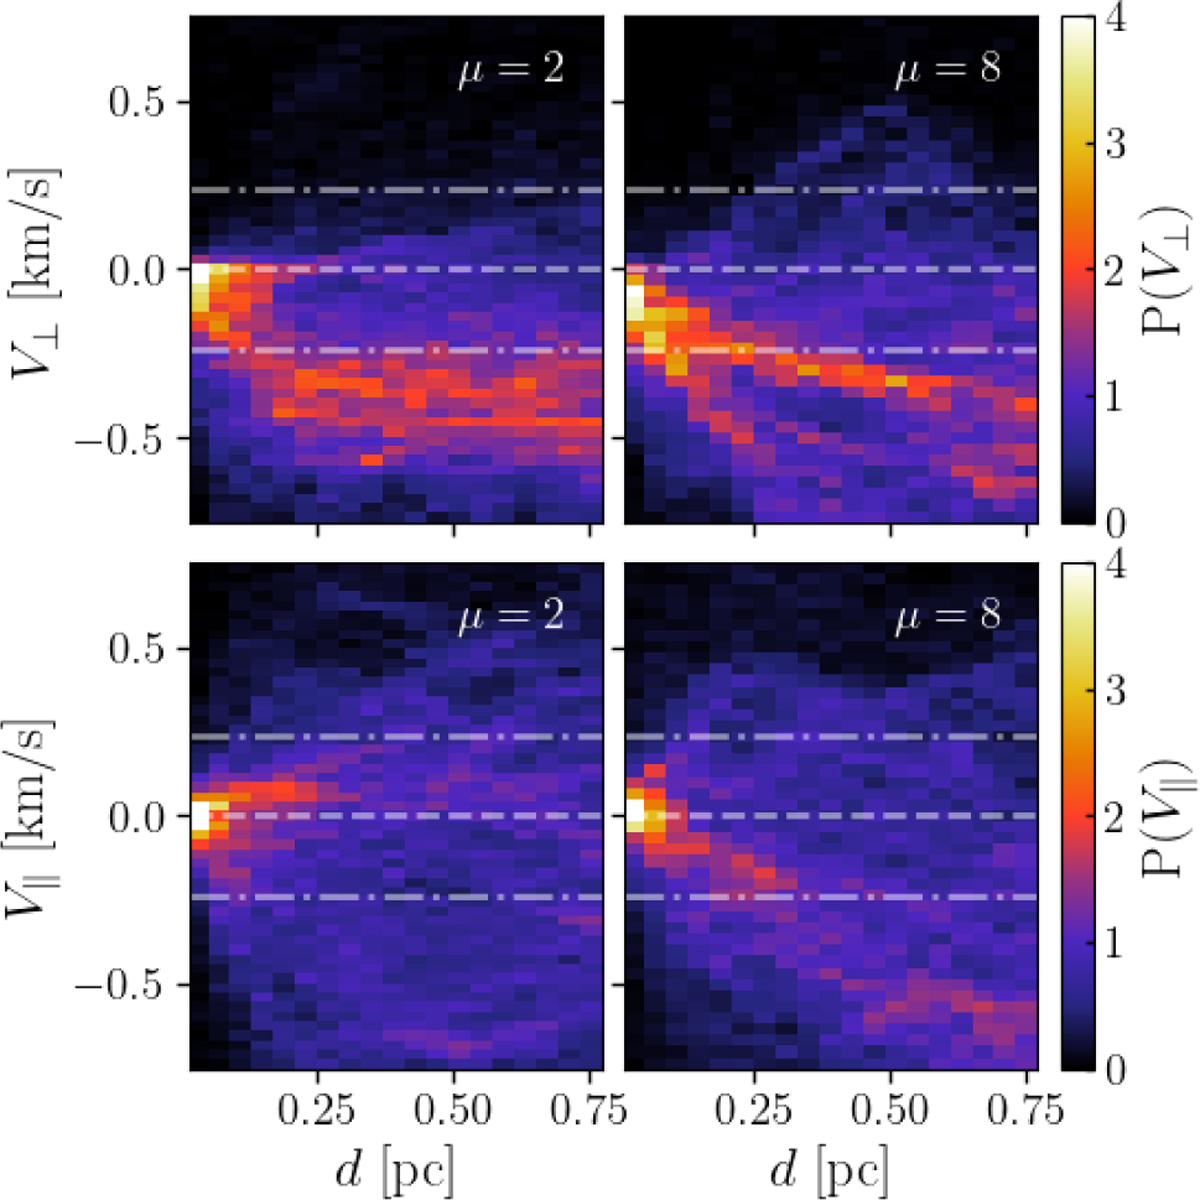
Distributions of the density-weighted average of the perpendicular (top row) and parallel (bottom row) component of the surrounding gas velocity relative to the filaments’ one at varying offsets from the filament crest. The dot-dashed lines give a reference sound speed of 0.24 km s−1, proper of a molecular medium at 10 K. The two simulations High_B (left column) and Low_B (right column) are shown at SFE = 3%. From the heatmaps, it is visible how the bulk of V⊥ distributions (top) drop to negative at larger offsets, that is infalling, velocities at larger offsets, stalling around −0.5 km s−1. In V∥ distributions, a similar trend is visible in μ = 8 filaments, where the negative velocities individuate faster flows inside of the filament than outside. Such behaviour is less visible in μ = 2 filaments.
Current usage metrics show cumulative count of Article Views (full-text article views including HTML views, PDF and ePub downloads, according to the available data) and Abstracts Views on Vision4Press platform.
Data correspond to usage on the plateform after 2015. The current usage metrics is available 48-96 hours after online publication and is updated daily on week days.
Initial download of the metrics may take a while.