Fig. 7
Download original image
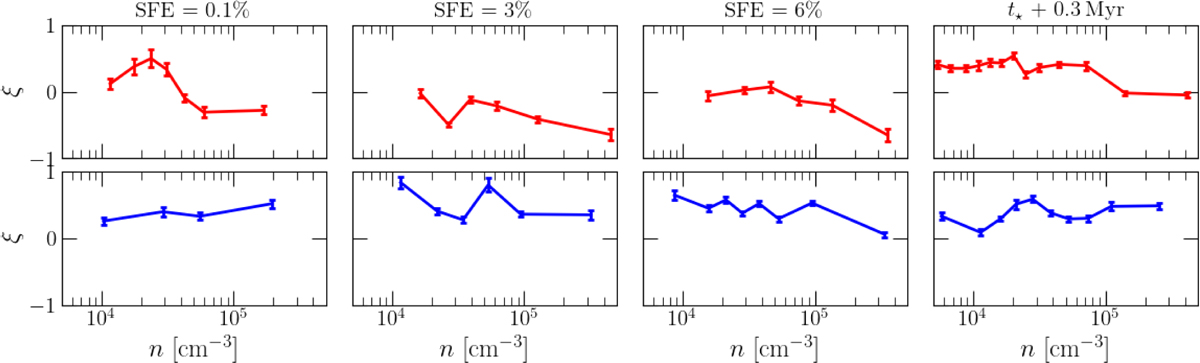
Histogram of relative orientation (Soler et al. 2013) throughout the simulations High_B (top) and Low_B (bottom). The graphs highlight the transition from parallel alignments in the low-density regime to more perpendicular ones as the density increases driven by the strength of B, which sets the threshold of this transition. From the last column we can evince how the expansion of the H II region promotes parallel alignments between the density structures and the magnetic field.
Current usage metrics show cumulative count of Article Views (full-text article views including HTML views, PDF and ePub downloads, according to the available data) and Abstracts Views on Vision4Press platform.
Data correspond to usage on the plateform after 2015. The current usage metrics is available 48-96 hours after online publication and is updated daily on week days.
Initial download of the metrics may take a while.