Fig. 4
Download original image
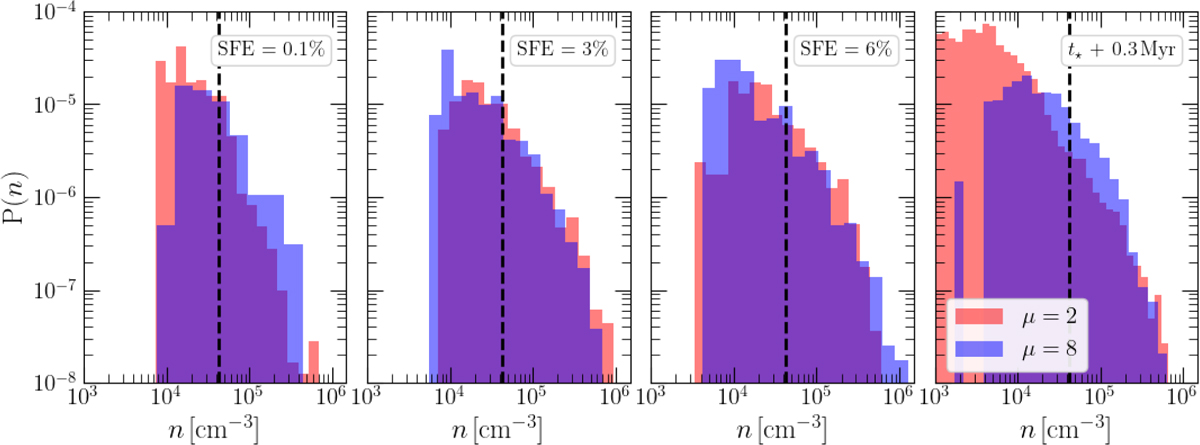
Distribution of the number density n of the filament crests in High_B (red) and Low_B (blue). The black dashed line marks the persistence threshold adopted. Filaments in High_B are initially less dense, and require more time to achieve a distribution similar to Low_B. After the onset of the H II region, the sparser morphology of High_B cloud causes the distribution to spread towards lower densities compared to Low_B.
Current usage metrics show cumulative count of Article Views (full-text article views including HTML views, PDF and ePub downloads, according to the available data) and Abstracts Views on Vision4Press platform.
Data correspond to usage on the plateform after 2015. The current usage metrics is available 48-96 hours after online publication and is updated daily on week days.
Initial download of the metrics may take a while.