Fig. 2
Download original image
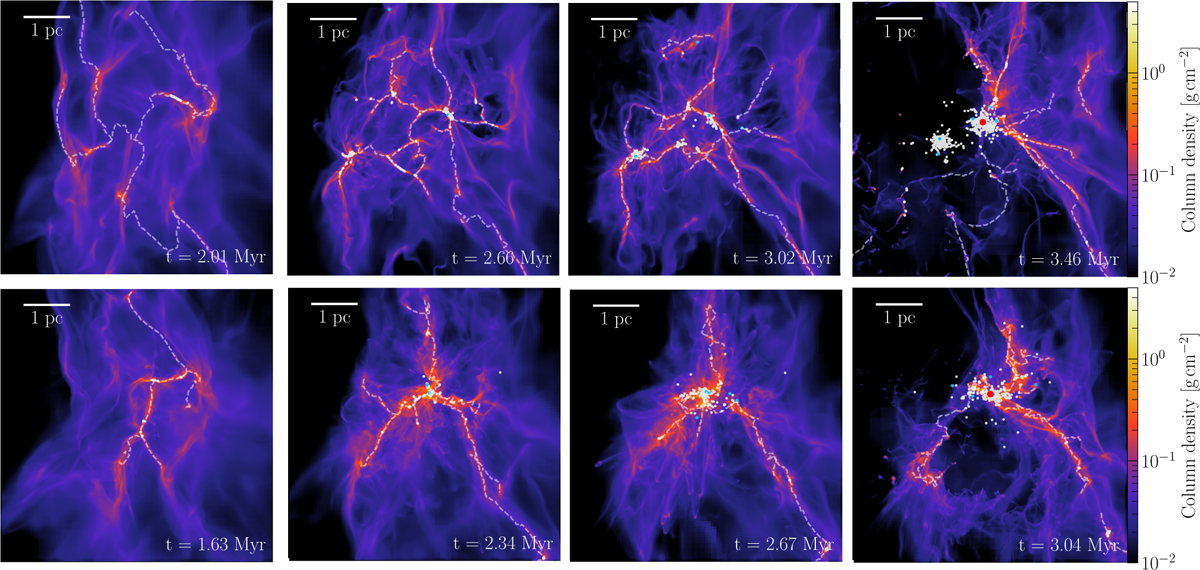
Evolution of the same cloud in the high- (High_B, top) and low-magnetisation case (Low_B, bottom). The first three columns display the column density projections of the cloud at equal SFE (from left to right: 0.1, 3 and 6%). The last column shows how the giant H II region reshapes the environment, showing the cloud after 0.3 Myr from the birth of the 100 M⊙ star. White dots mark the position of the sink particles, while blue dots highlight the ionising stars within the domain. The red dot represents the 100 M⊙ star from which the main H II originates. The grey dashed lines mark the filamentary structures retrieved by DisPerSE. These snapshots display the role of the B field in shaping the cloud structure (single hub vs sparse filamentary network) and influencing the timescale of the SF event.
Current usage metrics show cumulative count of Article Views (full-text article views including HTML views, PDF and ePub downloads, according to the available data) and Abstracts Views on Vision4Press platform.
Data correspond to usage on the plateform after 2015. The current usage metrics is available 48-96 hours after online publication and is updated daily on week days.
Initial download of the metrics may take a while.