Fig. B.1
Download original image
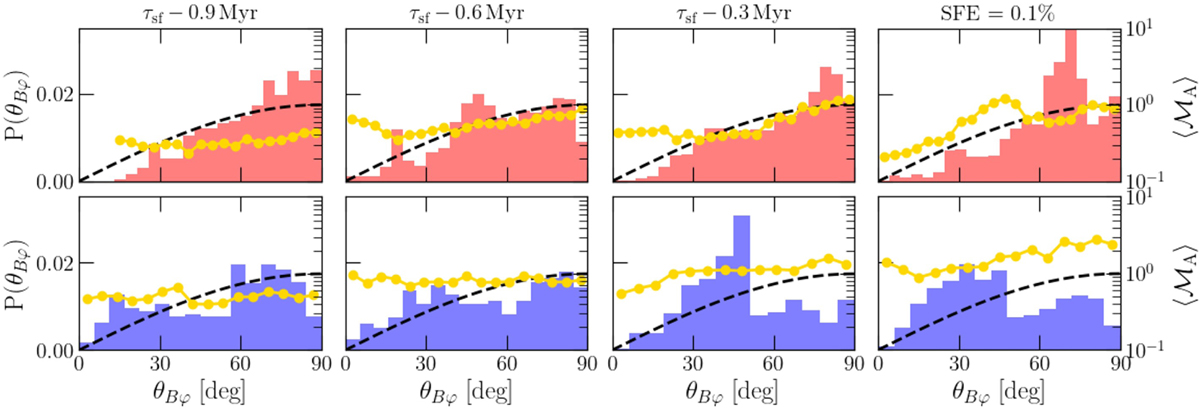
Distributions of the relative angle between the magnetic field and the filament (θBφ) in High_B (top) and Low_B (bottom), at different snapshots prior to the onset of the SF (τsf), corresponding to the S F E = 0.1% stage. The black dashed lines mark the random distribution for the relative orientation of two independent vectors in 3D. The yellow dotted lines mark the average Alfvén Mach number ℳA for filament portions at a given θBφ (scale on the right axis).
Current usage metrics show cumulative count of Article Views (full-text article views including HTML views, PDF and ePub downloads, according to the available data) and Abstracts Views on Vision4Press platform.
Data correspond to usage on the plateform after 2015. The current usage metrics is available 48-96 hours after online publication and is updated daily on week days.
Initial download of the metrics may take a while.