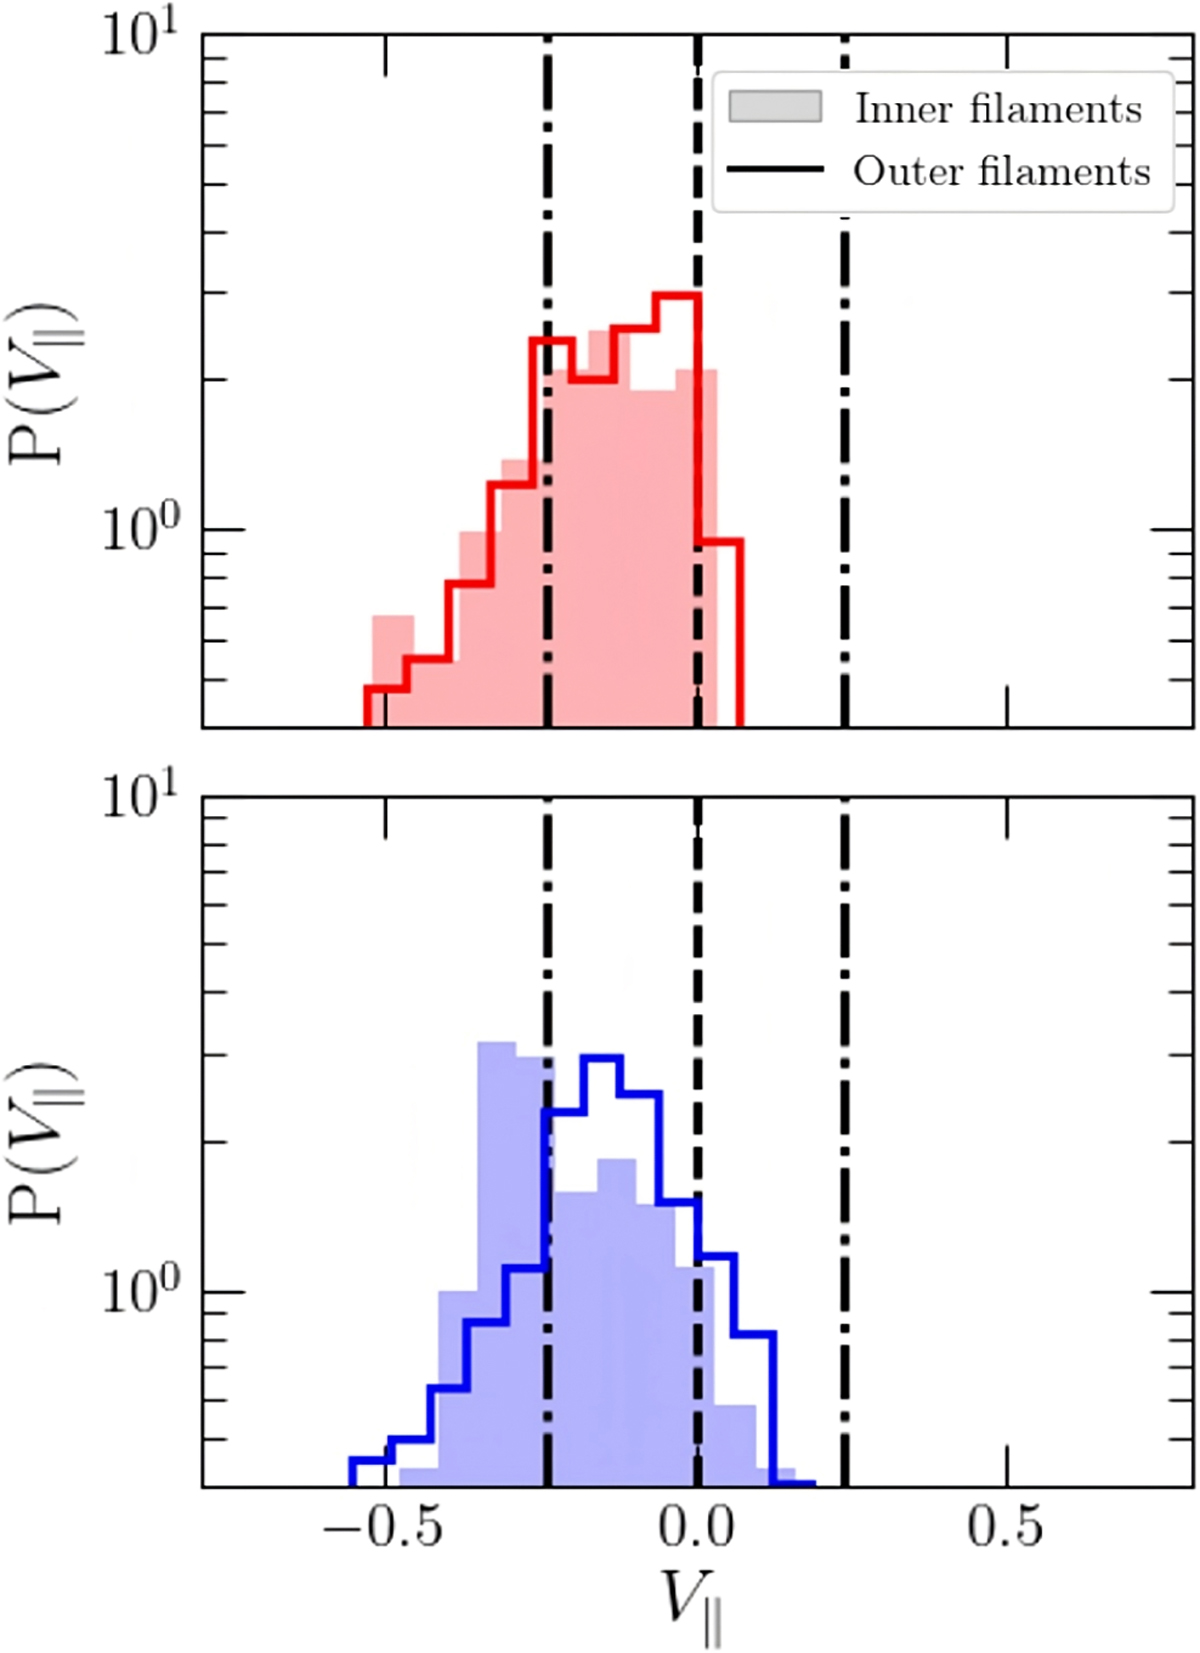
Fig. 12
Download original image
Distributions of V∥ in the two simulations (High_B top, Low_B bottom) at an offset of 0.1 pc from the filaments crest when SFE = 3%. The set has been divided between filament sections closer (filled histogram) and farther (hollow histogram) than 2 pc from the cloud centre. The black dot-dashed lines give a reference sound speed for a molecular medium at 10 K. All four distributions display a shift towards negative velocities (faster flows along the filaments relative to the surrounding gas). However, the shift in peak velocity between the inner and outer distributions, evident in Low_B but absent in High_B, suggests that in a well-developed HFS the faster flow in the filaments is driven by the central potential well. This supports the conveyor belt scenario, where filaments efficiently channel material toward the hub.
Current usage metrics show cumulative count of Article Views (full-text article views including HTML views, PDF and ePub downloads, according to the available data) and Abstracts Views on Vision4Press platform.
Data correspond to usage on the plateform after 2015. The current usage metrics is available 48-96 hours after online publication and is updated daily on week days.
Initial download of the metrics may take a while.