Fig. 10
Download original image
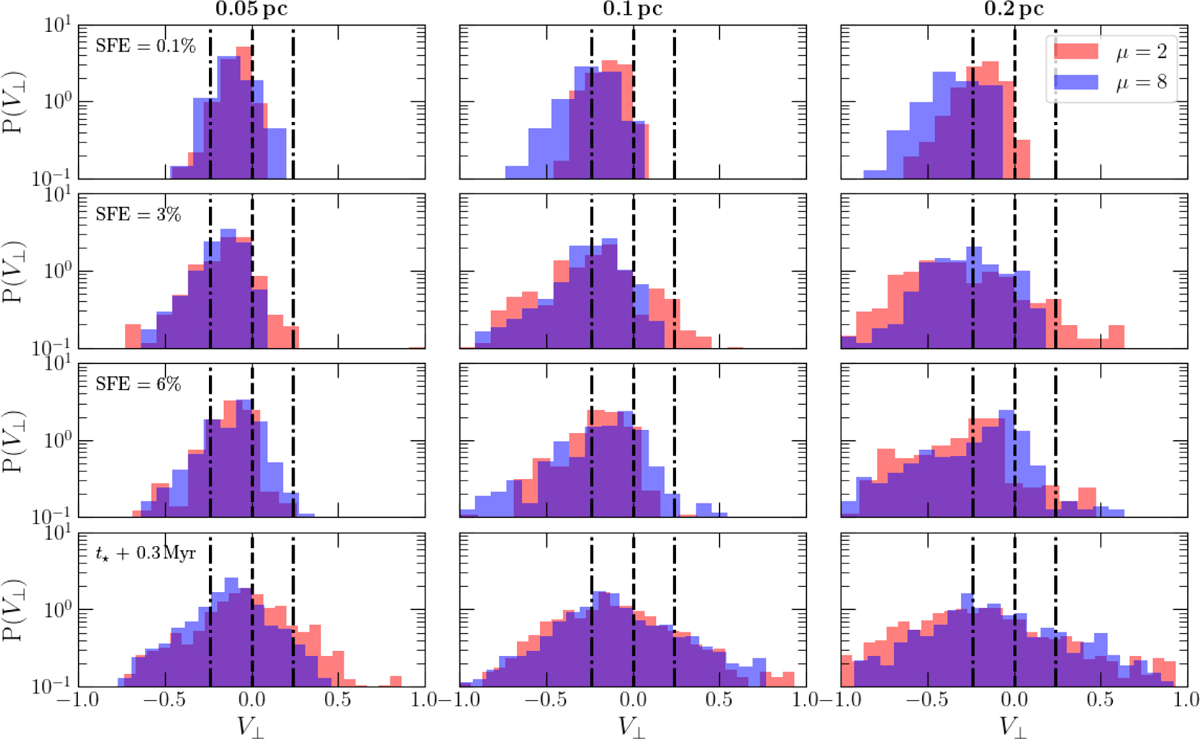
Evolution of the distribution of the perpendicular velocity V⊥ of the surrounding gas relative to the local filament frame in the two simulations High_B (red), Low_B (blue). Looking across the columns, the distributions are shown at three different radial offsets from the filament crest (0.05 pc, 0.1 pc, 0.2 pc), while the temporal evolution is displayed across the rows at different SFE of the cloud (0.1%, 3%, 6%) and 0.3 Myr after the onset of the main H II region (last row). The black dot-dashed lines give a reference sound speed for a molecular medium at 10 K. The overall preference towards negative V⊥ highlights how filaments never stop accreting. The widening of the wings during the feedback-dominated phase suggests more random velocities (cf. Fig. 8).
Current usage metrics show cumulative count of Article Views (full-text article views including HTML views, PDF and ePub downloads, according to the available data) and Abstracts Views on Vision4Press platform.
Data correspond to usage on the plateform after 2015. The current usage metrics is available 48-96 hours after online publication and is updated daily on week days.
Initial download of the metrics may take a while.