Fig. 1
Download original image
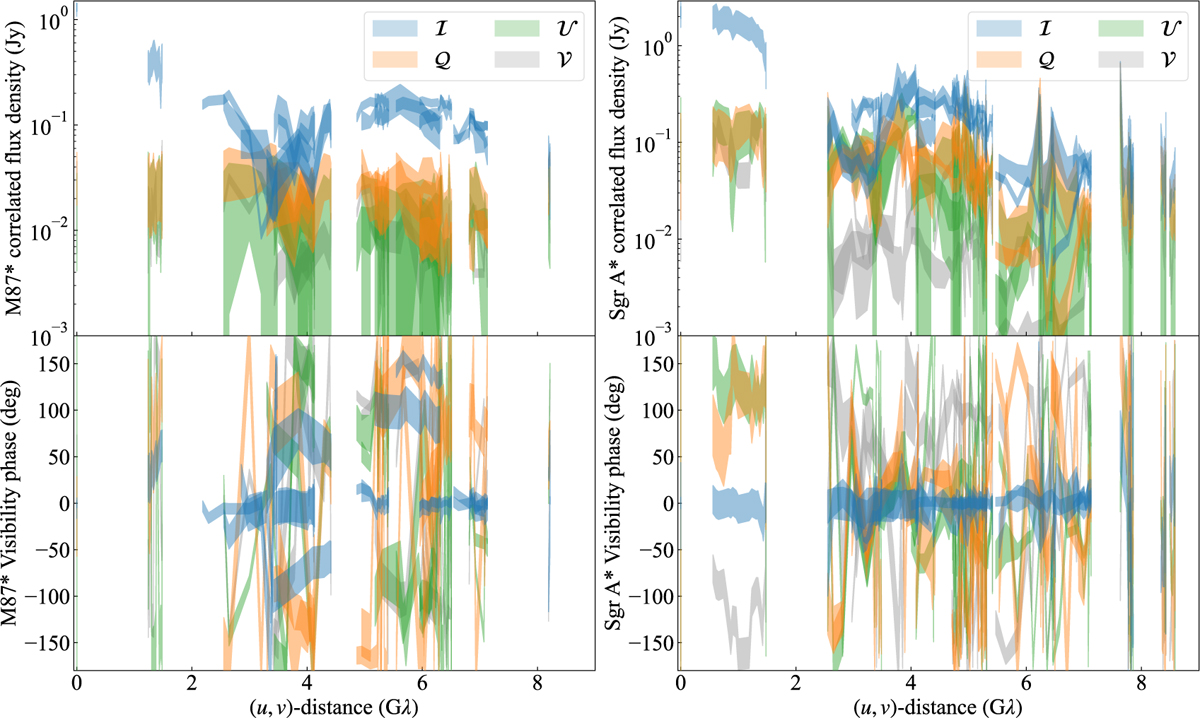
Correlated flux densities in Jansky (Jy) and visibility phases in degrees (deg) with standard deviation error bands computed from 1000 bootstrapping realization of the 2017 April 11 M87* (left panels) and April 7 Sgr A* (right panels) observational EHT data. The measurements are plotted as a function of baseline length in units of the λ1.3 mm observing wavelength. The displayed Stokes parameters show the total intensity (I), linear polarization (Q&U), and circular polarization\ (V).
Current usage metrics show cumulative count of Article Views (full-text article views including HTML views, PDF and ePub downloads, according to the available data) and Abstracts Views on Vision4Press platform.
Data correspond to usage on the plateform after 2015. The current usage metrics is available 48-96 hours after online publication and is updated daily on week days.
Initial download of the metrics may take a while.