Fig. 6
Download original image
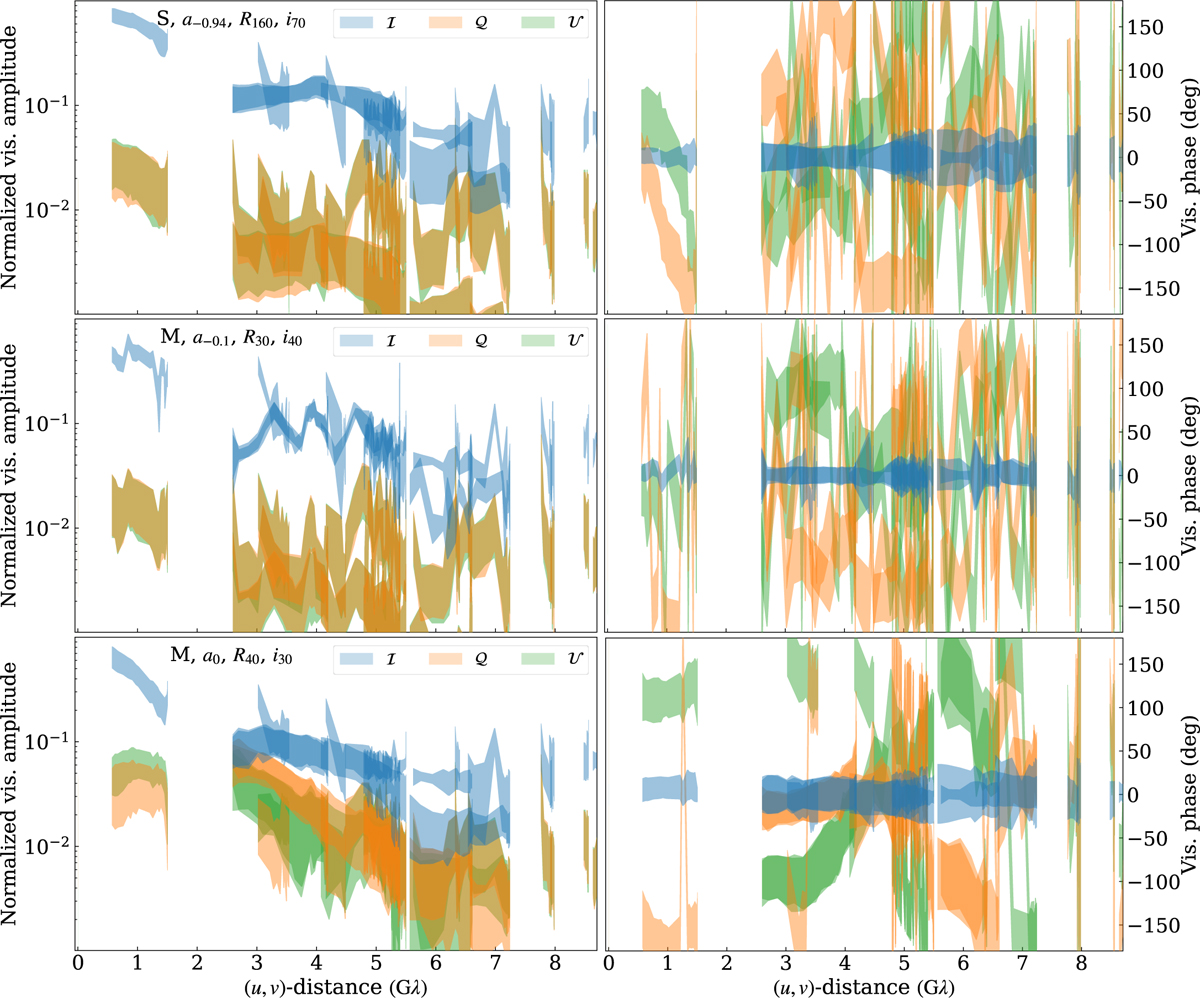
Normalized visibility amplitudes and phases in degrees (deg) color-coded by ℐ, 𝒬, 𝒰 Stokes parameters with standard deviation error bands computed from 100 synthetic data realizations of 2017 Sgr A* EHT observations with corresponding (u, v) coverage are displayed. The parameters for the three models considered here are given in the top left corners of the amplitude plots in the left column: a S(ANE) model in the top row and two different M(AD) models in the middle and bottom rows. The model in the middle is from test data, which has smaller error bars because the underlying simulation was run for a shorter time, leading to a smaller model variability.
Current usage metrics show cumulative count of Article Views (full-text article views including HTML views, PDF and ePub downloads, according to the available data) and Abstracts Views on Vision4Press platform.
Data correspond to usage on the plateform after 2015. The current usage metrics is available 48-96 hours after online publication and is updated daily on week days.
Initial download of the metrics may take a while.