Open Access
Fig. 2
Download original image
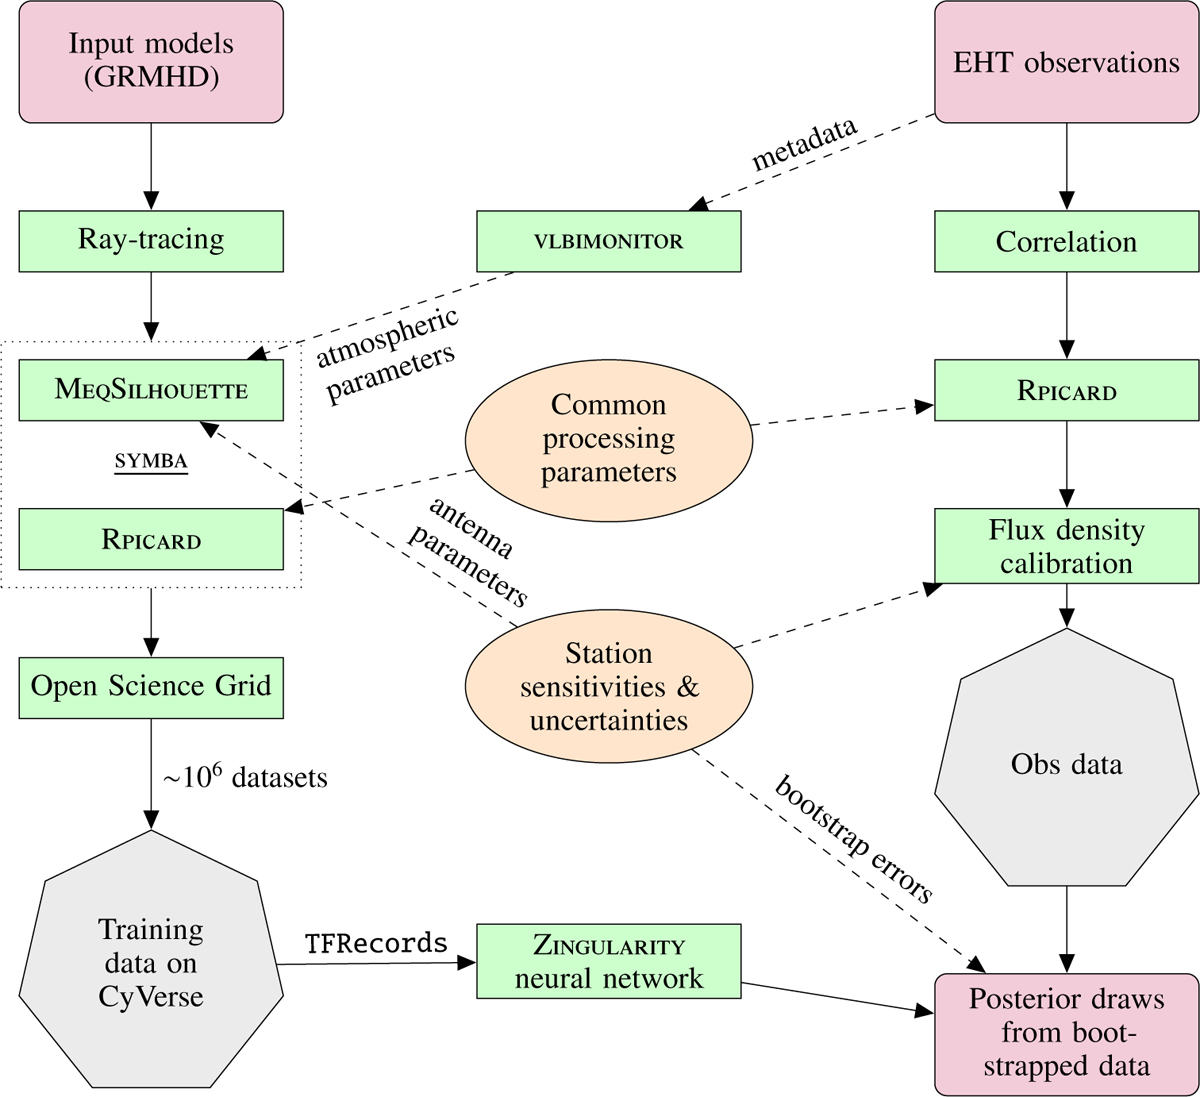
Flowchart of the ZINGULARITY data streams. The left column shows the pathway from the input theory models ![]() to the training data
to the training data ![]() . The right column shows the processing chain for the observational EHT data
. The right column shows the processing chain for the observational EHT data ![]() . The central column presents the common metadata used.
. The central column presents the common metadata used.
Current usage metrics show cumulative count of Article Views (full-text article views including HTML views, PDF and ePub downloads, according to the available data) and Abstracts Views on Vision4Press platform.
Data correspond to usage on the plateform after 2015. The current usage metrics is available 48-96 hours after online publication and is updated daily on week days.
Initial download of the metrics may take a while.