Fig. 1
Download original image
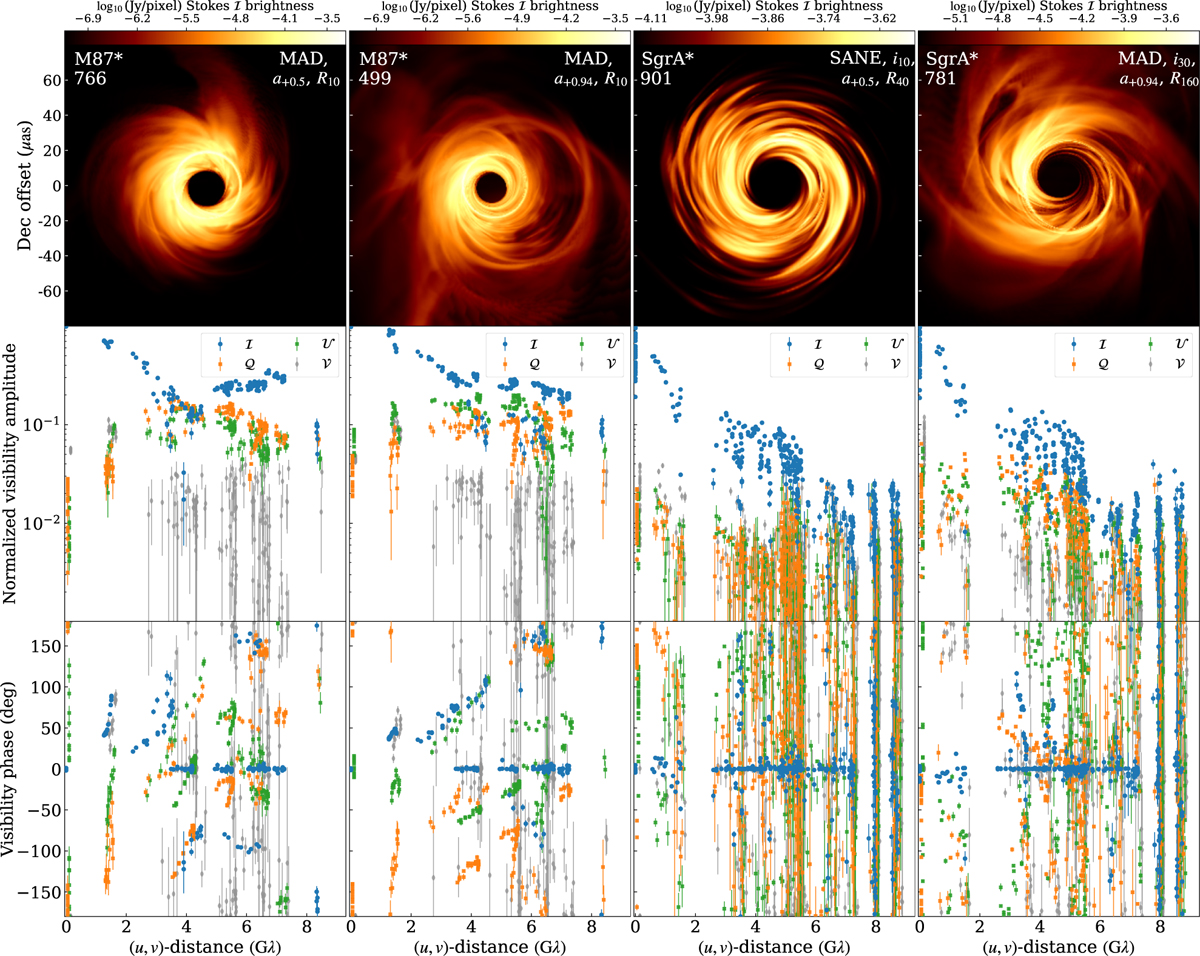
Four training dataset examples. The top row shows the total intensity ray-traced ground-truth model images on logarithmic scales with varying dynamic ranges. Normalized full-pol visibility amplitudes and phases of corresponding synthetic data realizations are displayed with thermal noise error bars as a function of baseline length in units of the observing wavelength λ ≈ 1.3 mm (see Janssen et al. 2025a for the (u, v) coverage) in the middle and bottom rows, respectively. The measurements shown can come from different orientations at the same baseline length. For a better readability, the visibilities have been averaged over scan durations, normalized amplitudes lower than 0.001 have been clipped, and the values of the different Stokes parameters are each offset by 50 Mλ on the x-axis. In the top left corner of each model image is indicated whether the model and data correspond to M87* or Sgr A* and the GRRT frame number of the image. The strongly time-variable Sgr A* data were generated from multiple GRRT frames, of which a single frame is displayed here. Spin a* = s, Rhigh = r, and ilos = l parameters are listed in a shorthand notation as as, Rr, and il in the top right corner of each model image. The Sgr A* models are shown here with θPA = 0.
Current usage metrics show cumulative count of Article Views (full-text article views including HTML views, PDF and ePub downloads, according to the available data) and Abstracts Views on Vision4Press platform.
Data correspond to usage on the plateform after 2015. The current usage metrics is available 48-96 hours after online publication and is updated daily on week days.
Initial download of the metrics may take a while.