Fig. 8
Download original image
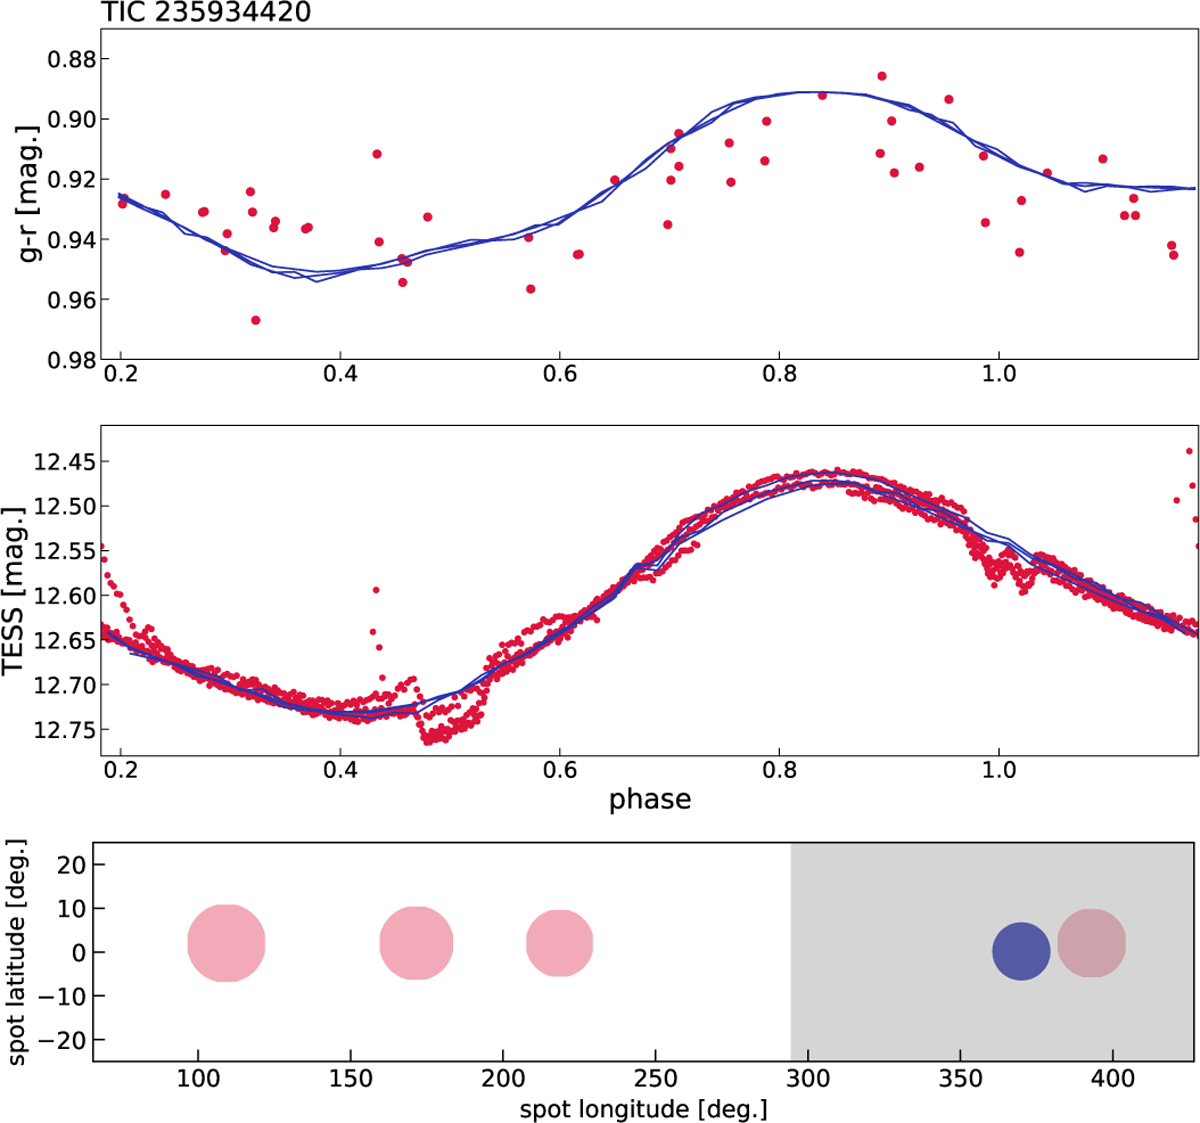
Contemporaneous ZTF and TESS data modeling of TIC 235934420. Top: the fitted ZTF g − r color index reflecting the temperature at the given rotation phase. The depressions in the color index curve around the derived spots indicate a redder color and thus a lower temperature. Middle: phase-folded fit to the contemporaneous TESS data. Bottom: locations of the spots on the stellar surface from the second observed minimum at HJD 2458691.506 (see Fig. 9) from time series modeling (red) and eclipse mapping (blue). Gray shading shows the longitudes scanned by the companion star.
Current usage metrics show cumulative count of Article Views (full-text article views including HTML views, PDF and ePub downloads, according to the available data) and Abstracts Views on Vision4Press platform.
Data correspond to usage on the plateform after 2015. The current usage metrics is available 48-96 hours after online publication and is updated daily on week days.
Initial download of the metrics may take a while.