Fig. 7
Download original image
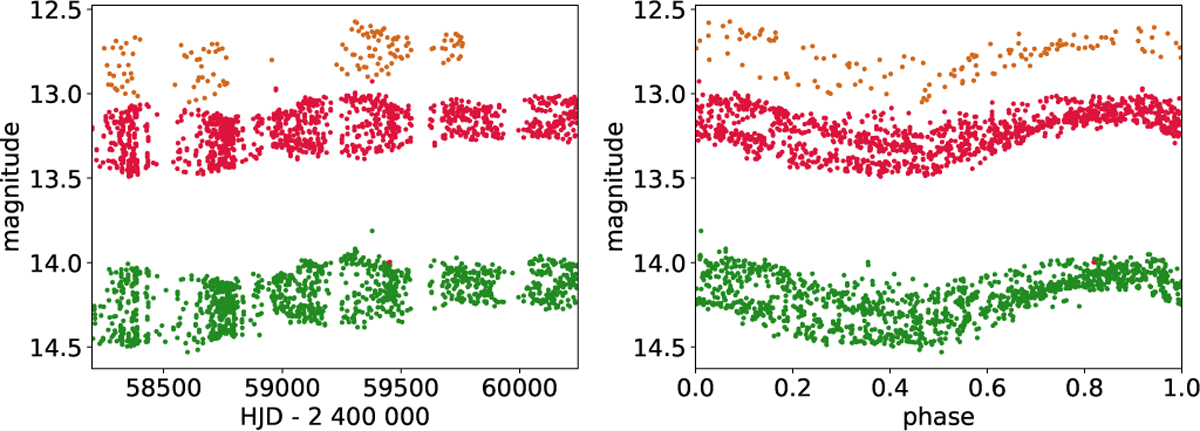
ZTF observations of TIC 235934420. Green, red, and brown points show the g, r, and i band data, respectively. The shape and amplitude of the light curves are slowly and continuously changing.
Current usage metrics show cumulative count of Article Views (full-text article views including HTML views, PDF and ePub downloads, according to the available data) and Abstracts Views on Vision4Press platform.
Data correspond to usage on the plateform after 2015. The current usage metrics is available 48-96 hours after online publication and is updated daily on week days.
Initial download of the metrics may take a while.