Fig. 4
Download original image
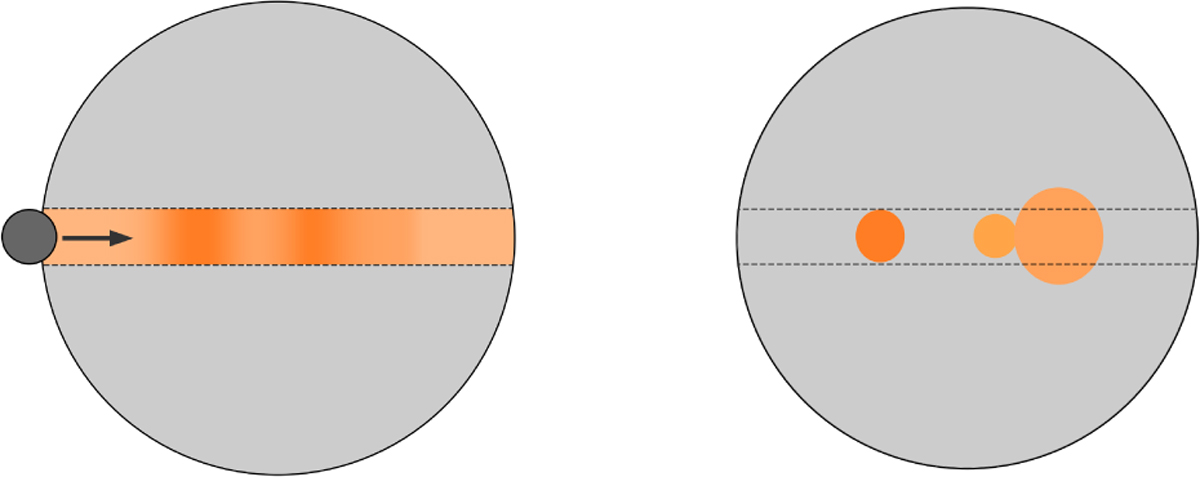
Spot eclipses on the surface of a giant star by its secondary. The horizontal belt shows the scanned latitudes. Left: the path of the secondary star as it moves through the spots shown by the color coded pattern of the photometry during eclipses, right: the resulting three spots after the solution. The coloring of the features in both panels reflects the different contrasts of the spots to the stellar photospheres.
Current usage metrics show cumulative count of Article Views (full-text article views including HTML views, PDF and ePub downloads, according to the available data) and Abstracts Views on Vision4Press platform.
Data correspond to usage on the plateform after 2015. The current usage metrics is available 48-96 hours after online publication and is updated daily on week days.
Initial download of the metrics may take a while.