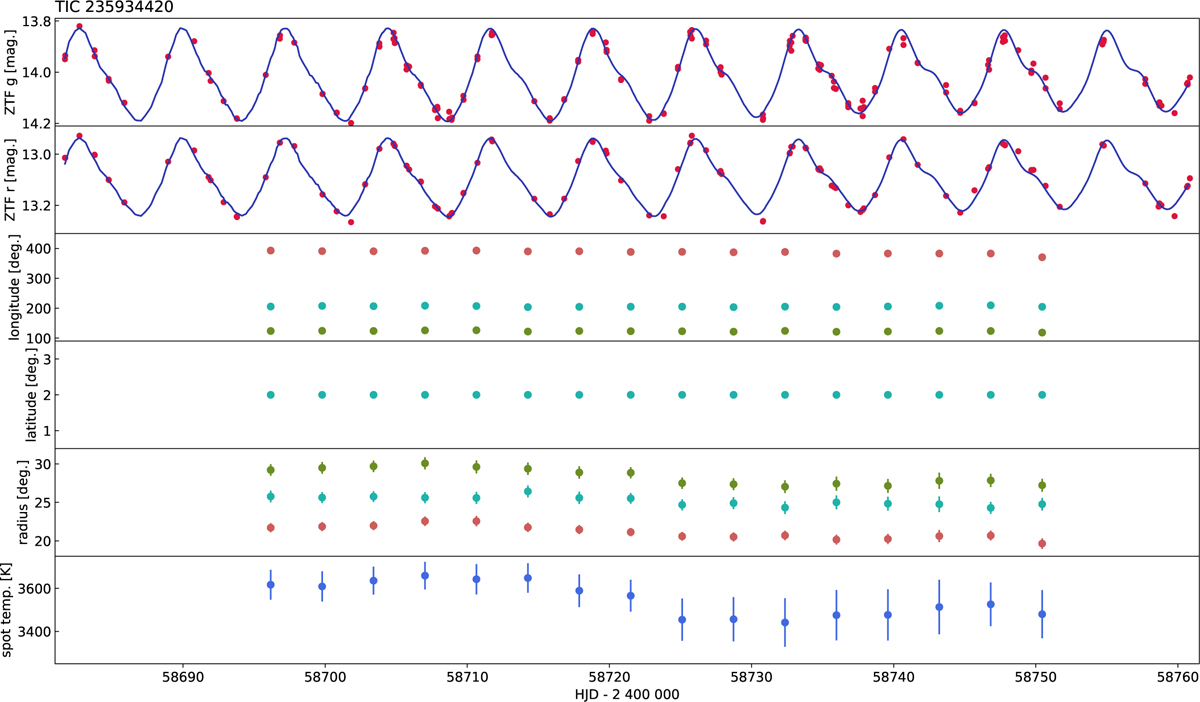
Fig. B.1
Download original image
Fitted ZTF g and r data and the resulting spot and temperature parameters. From top to bottom: ZTF g and r observations are shown with their fits. Further below the spots’ longitudes, latitudes (fixed), and radii, with their errors, and the resulted spot temperatures and errors, are plotted.
Current usage metrics show cumulative count of Article Views (full-text article views including HTML views, PDF and ePub downloads, according to the available data) and Abstracts Views on Vision4Press platform.
Data correspond to usage on the plateform after 2015. The current usage metrics is available 48-96 hours after online publication and is updated daily on week days.
Initial download of the metrics may take a while.