Fig. 2
Download original image
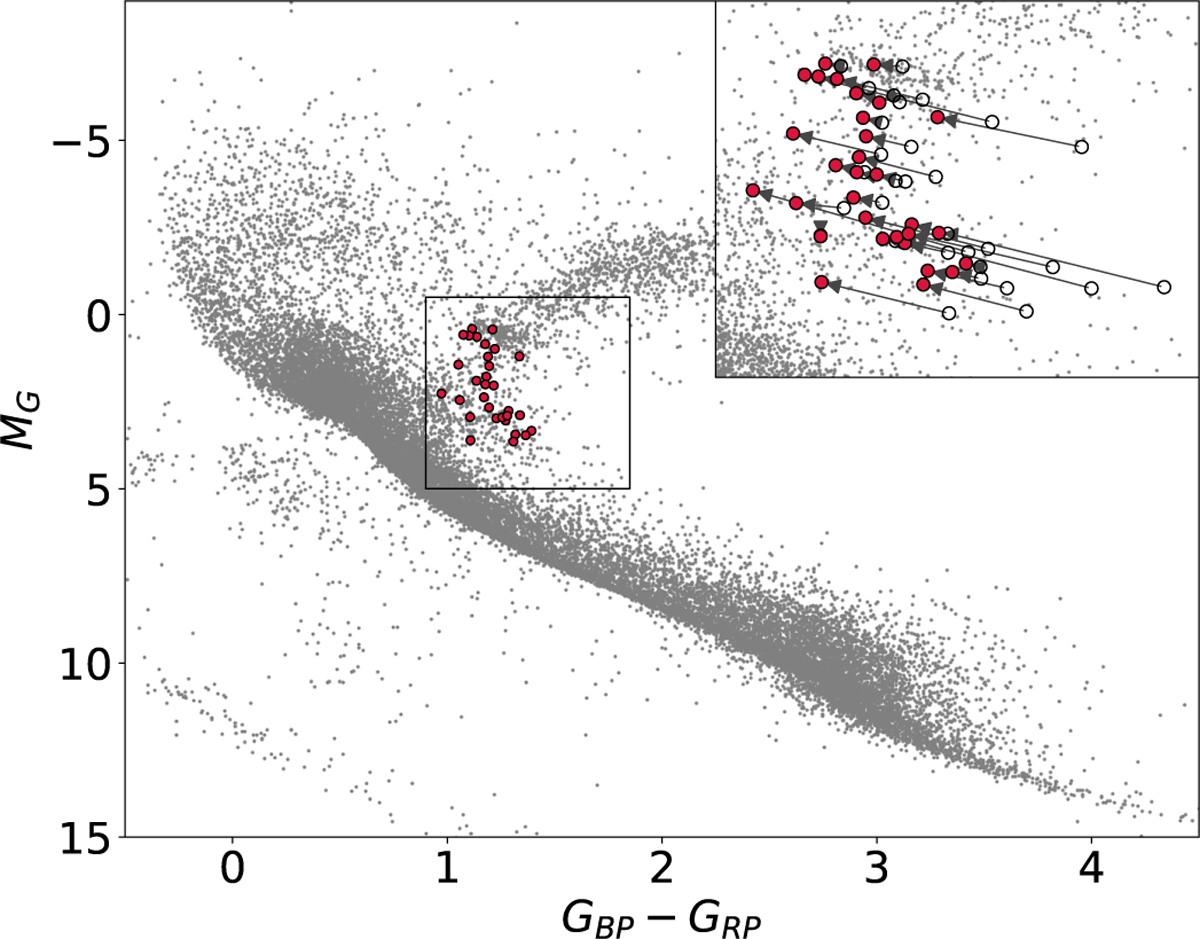
Sample binaries on the Gaia DR3 color–magnitude diagram. Red circles show the values after the extinction and reddening correction, the empty circles in the inset are the original uncorrected values. The gray points show a representative sample of the solar neighborhood for reference.
Current usage metrics show cumulative count of Article Views (full-text article views including HTML views, PDF and ePub downloads, according to the available data) and Abstracts Views on Vision4Press platform.
Data correspond to usage on the plateform after 2015. The current usage metrics is available 48-96 hours after online publication and is updated daily on week days.
Initial download of the metrics may take a while.