Fig. 16
Download original image
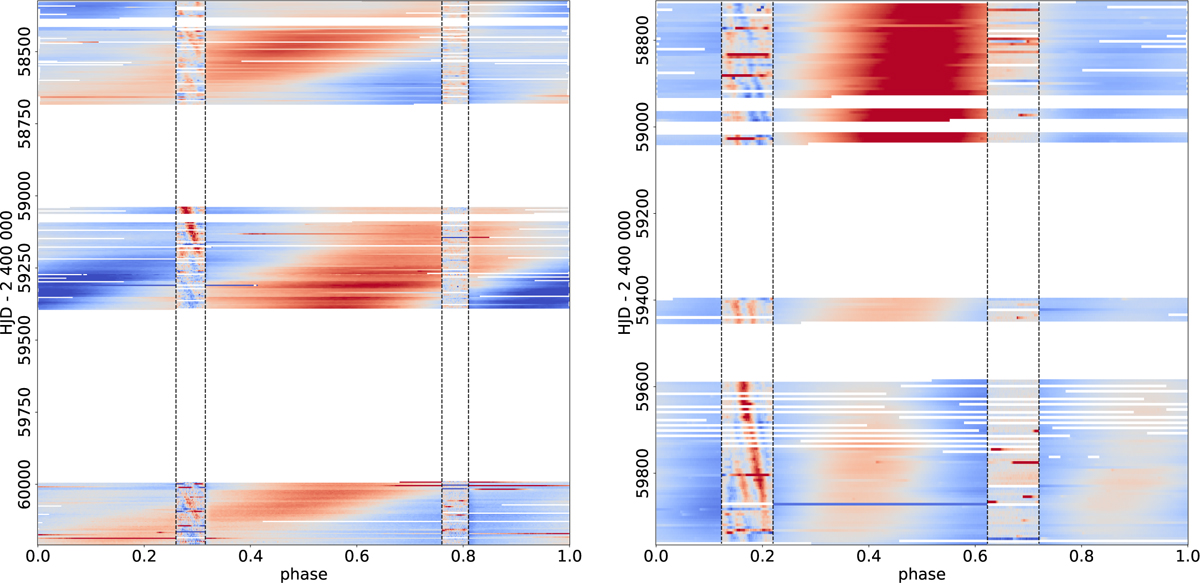
Full light curve of TIC 271892852 (left) and TIC 326257590 (right) folded with the orbital periods of the systems. In the out-of-eclipse phases, the original light curve is shown, illustrating the spot modulation, whereas during the eclipses (marked with dashed lines) the residual light curve is shown after removing the average eclipse signal, enhancing the spot occultation features. The color coding goes from blue to red with increasing brightness, scaled separately in- and out-of-eclipse to highlight the main features.
Current usage metrics show cumulative count of Article Views (full-text article views including HTML views, PDF and ePub downloads, according to the available data) and Abstracts Views on Vision4Press platform.
Data correspond to usage on the plateform after 2015. The current usage metrics is available 48-96 hours after online publication and is updated daily on week days.
Initial download of the metrics may take a while.