Fig. 14
Download original image
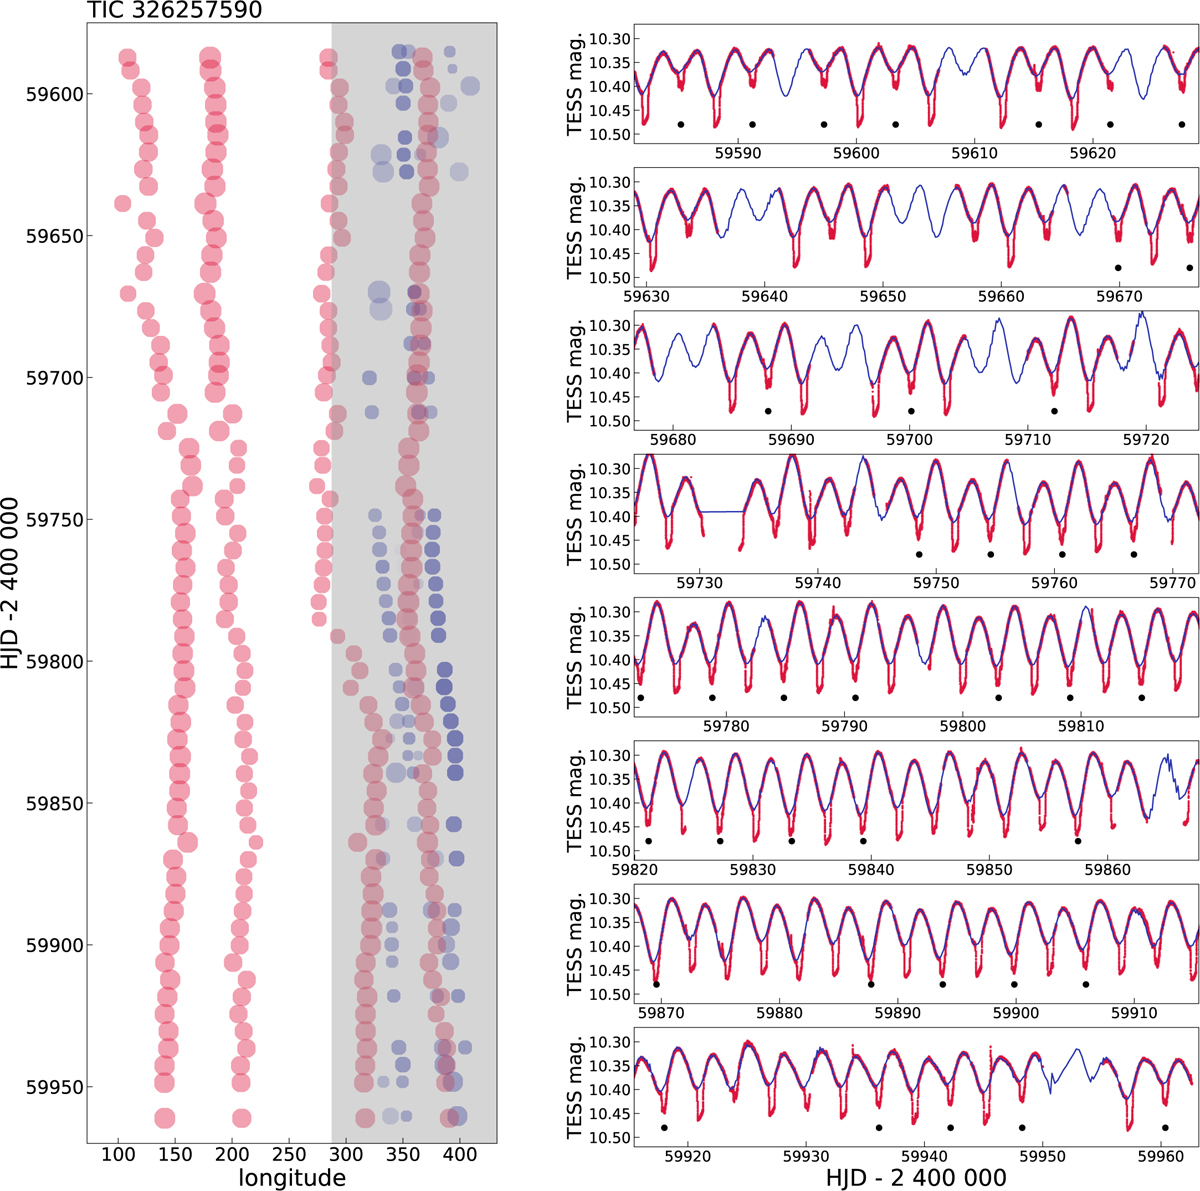
Left: changing longitudes of spots of TIC 326257590 in time. Red and blue circles result from time-series photometric modeling and eclipse mapping, respectively. The shade of the blue circles reflects the contrasts of the spots from eclipse mapping. Note that the x-axis of the figure covers one stellar circumference in longitude. Gray shading shows the longitudes scanned by the companion star. Right: light curve fitted by four spots. Black dots mark those eclipses that are mapped.
Current usage metrics show cumulative count of Article Views (full-text article views including HTML views, PDF and ePub downloads, according to the available data) and Abstracts Views on Vision4Press platform.
Data correspond to usage on the plateform after 2015. The current usage metrics is available 48-96 hours after online publication and is updated daily on week days.
Initial download of the metrics may take a while.