Fig. 10
Download original image
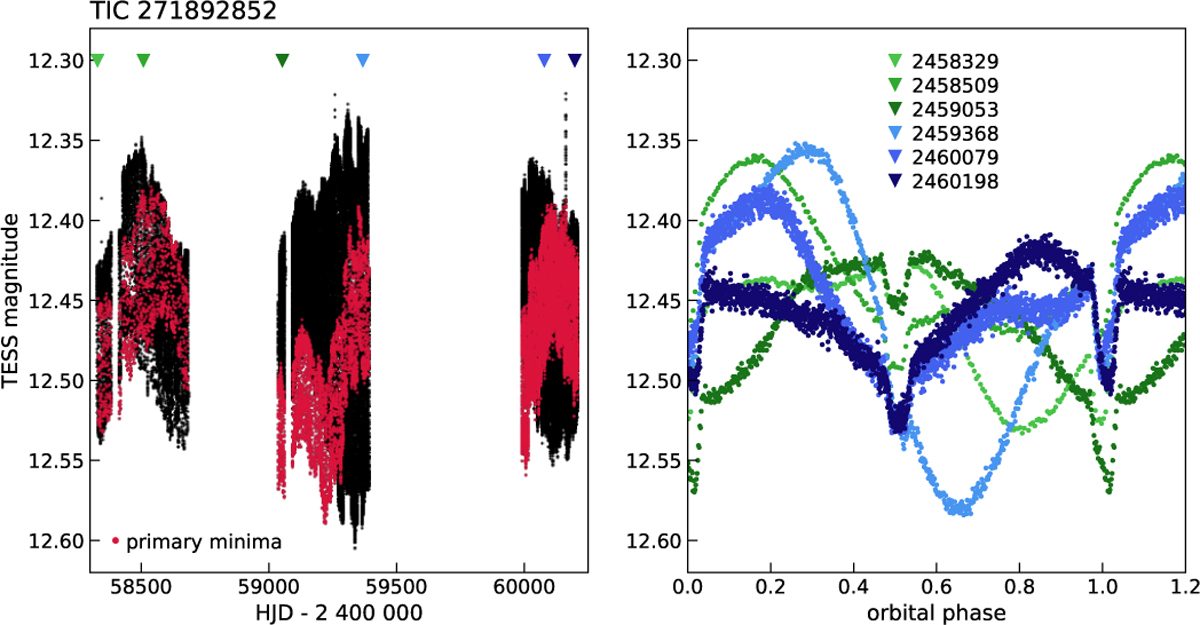
Left panel: TESS observations of TIC 271892852 made between July 2018 and September 2023, with the primary eclipses marked with red. Six individual light curves are marked with different colors and are phased with the orbital period in the right panel, showing the variability of the light curves due to spots at different epochs.
Current usage metrics show cumulative count of Article Views (full-text article views including HTML views, PDF and ePub downloads, according to the available data) and Abstracts Views on Vision4Press platform.
Data correspond to usage on the plateform after 2015. The current usage metrics is available 48-96 hours after online publication and is updated daily on week days.
Initial download of the metrics may take a while.