Fig. 7
Download original image
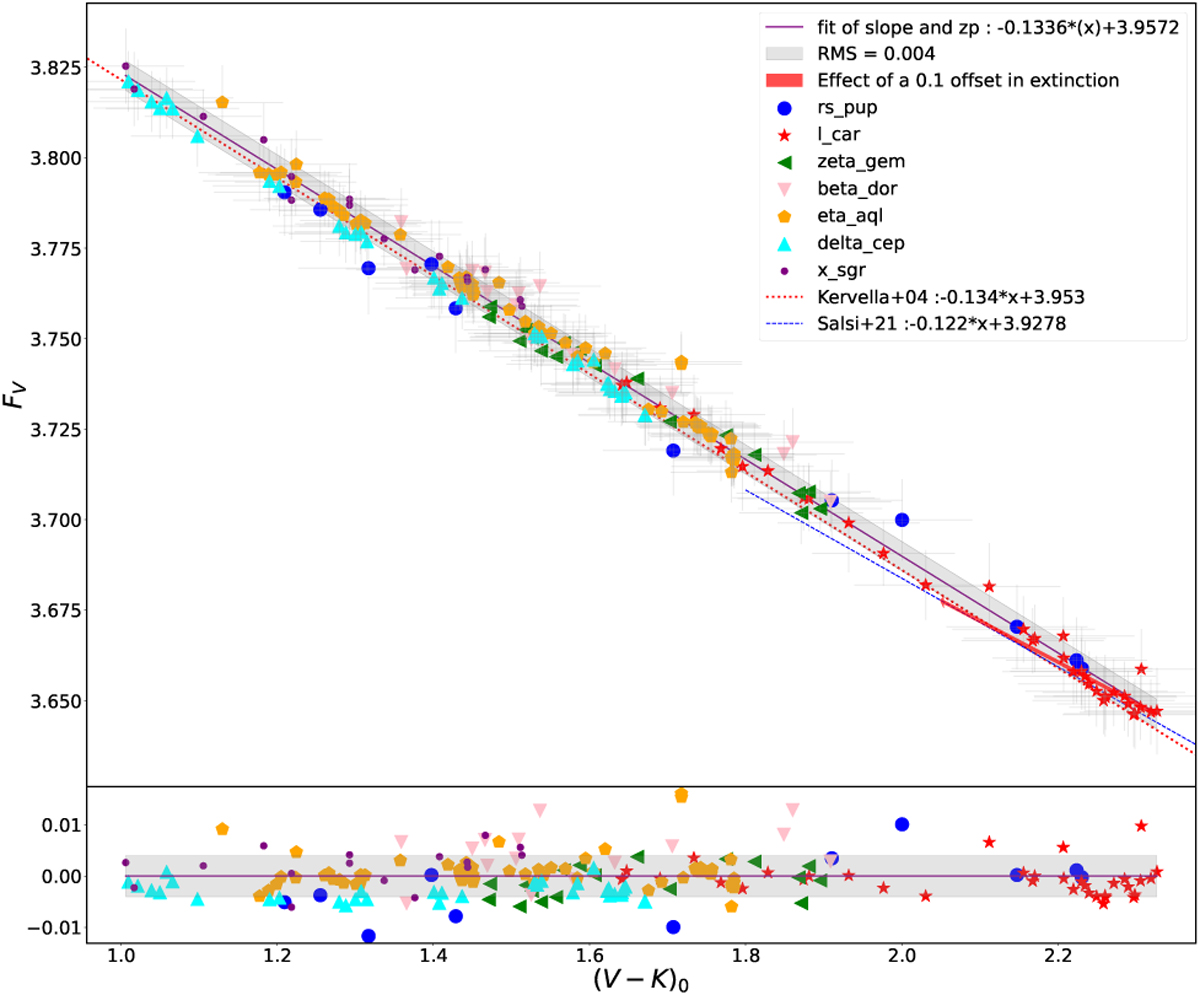
Linear fit (purple line) of the SBCR (FV, V − K) obtained with V and K magnitudes. The seven different Cepheids used to calibrate this SBCR are shown by different symbols. The dotted blue line corresponds to the relation found by Salsi et al. (2021) for giant stars. The dotted red line corresponds to the SBCR found by Kervella et al. (2004a), for Cepheids. The grey area indicates the RMS of the fit. The residual of the fit and the RMS are plotted in the lower panel.
Current usage metrics show cumulative count of Article Views (full-text article views including HTML views, PDF and ePub downloads, according to the available data) and Abstracts Views on Vision4Press platform.
Data correspond to usage on the plateform after 2015. The current usage metrics is available 48-96 hours after online publication and is updated daily on week days.
Initial download of the metrics may take a while.