Fig. E.1
Download original image
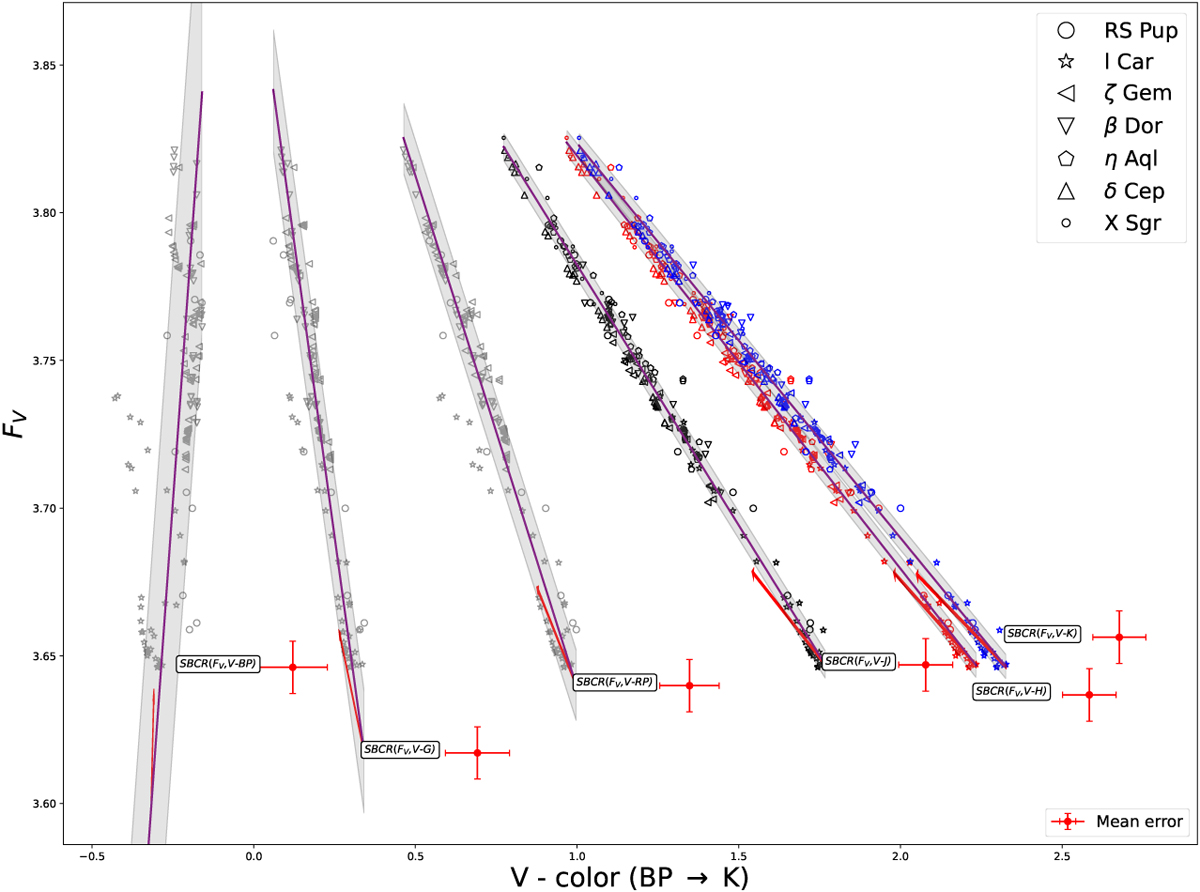
SBCR (Fλ1, magλ1-magλ2) for all possible colour indices combination based on λ1 = V and λ2 = GBP, G, GRP, J, H, and K (from left to right). The mean error associated with FV and the colour are indicated by a red cross for each SBCR. The three SBCRs on the left (in grey) are shown for indication but should not be used in the context of the BW method (see text). The red arrows show the effect on the SBCRs of a 0.1 magnitude offset in E(B − V).
Current usage metrics show cumulative count of Article Views (full-text article views including HTML views, PDF and ePub downloads, according to the available data) and Abstracts Views on Vision4Press platform.
Data correspond to usage on the plateform after 2015. The current usage metrics is available 48-96 hours after online publication and is updated daily on week days.
Initial download of the metrics may take a while.