Fig. 12
Download original image
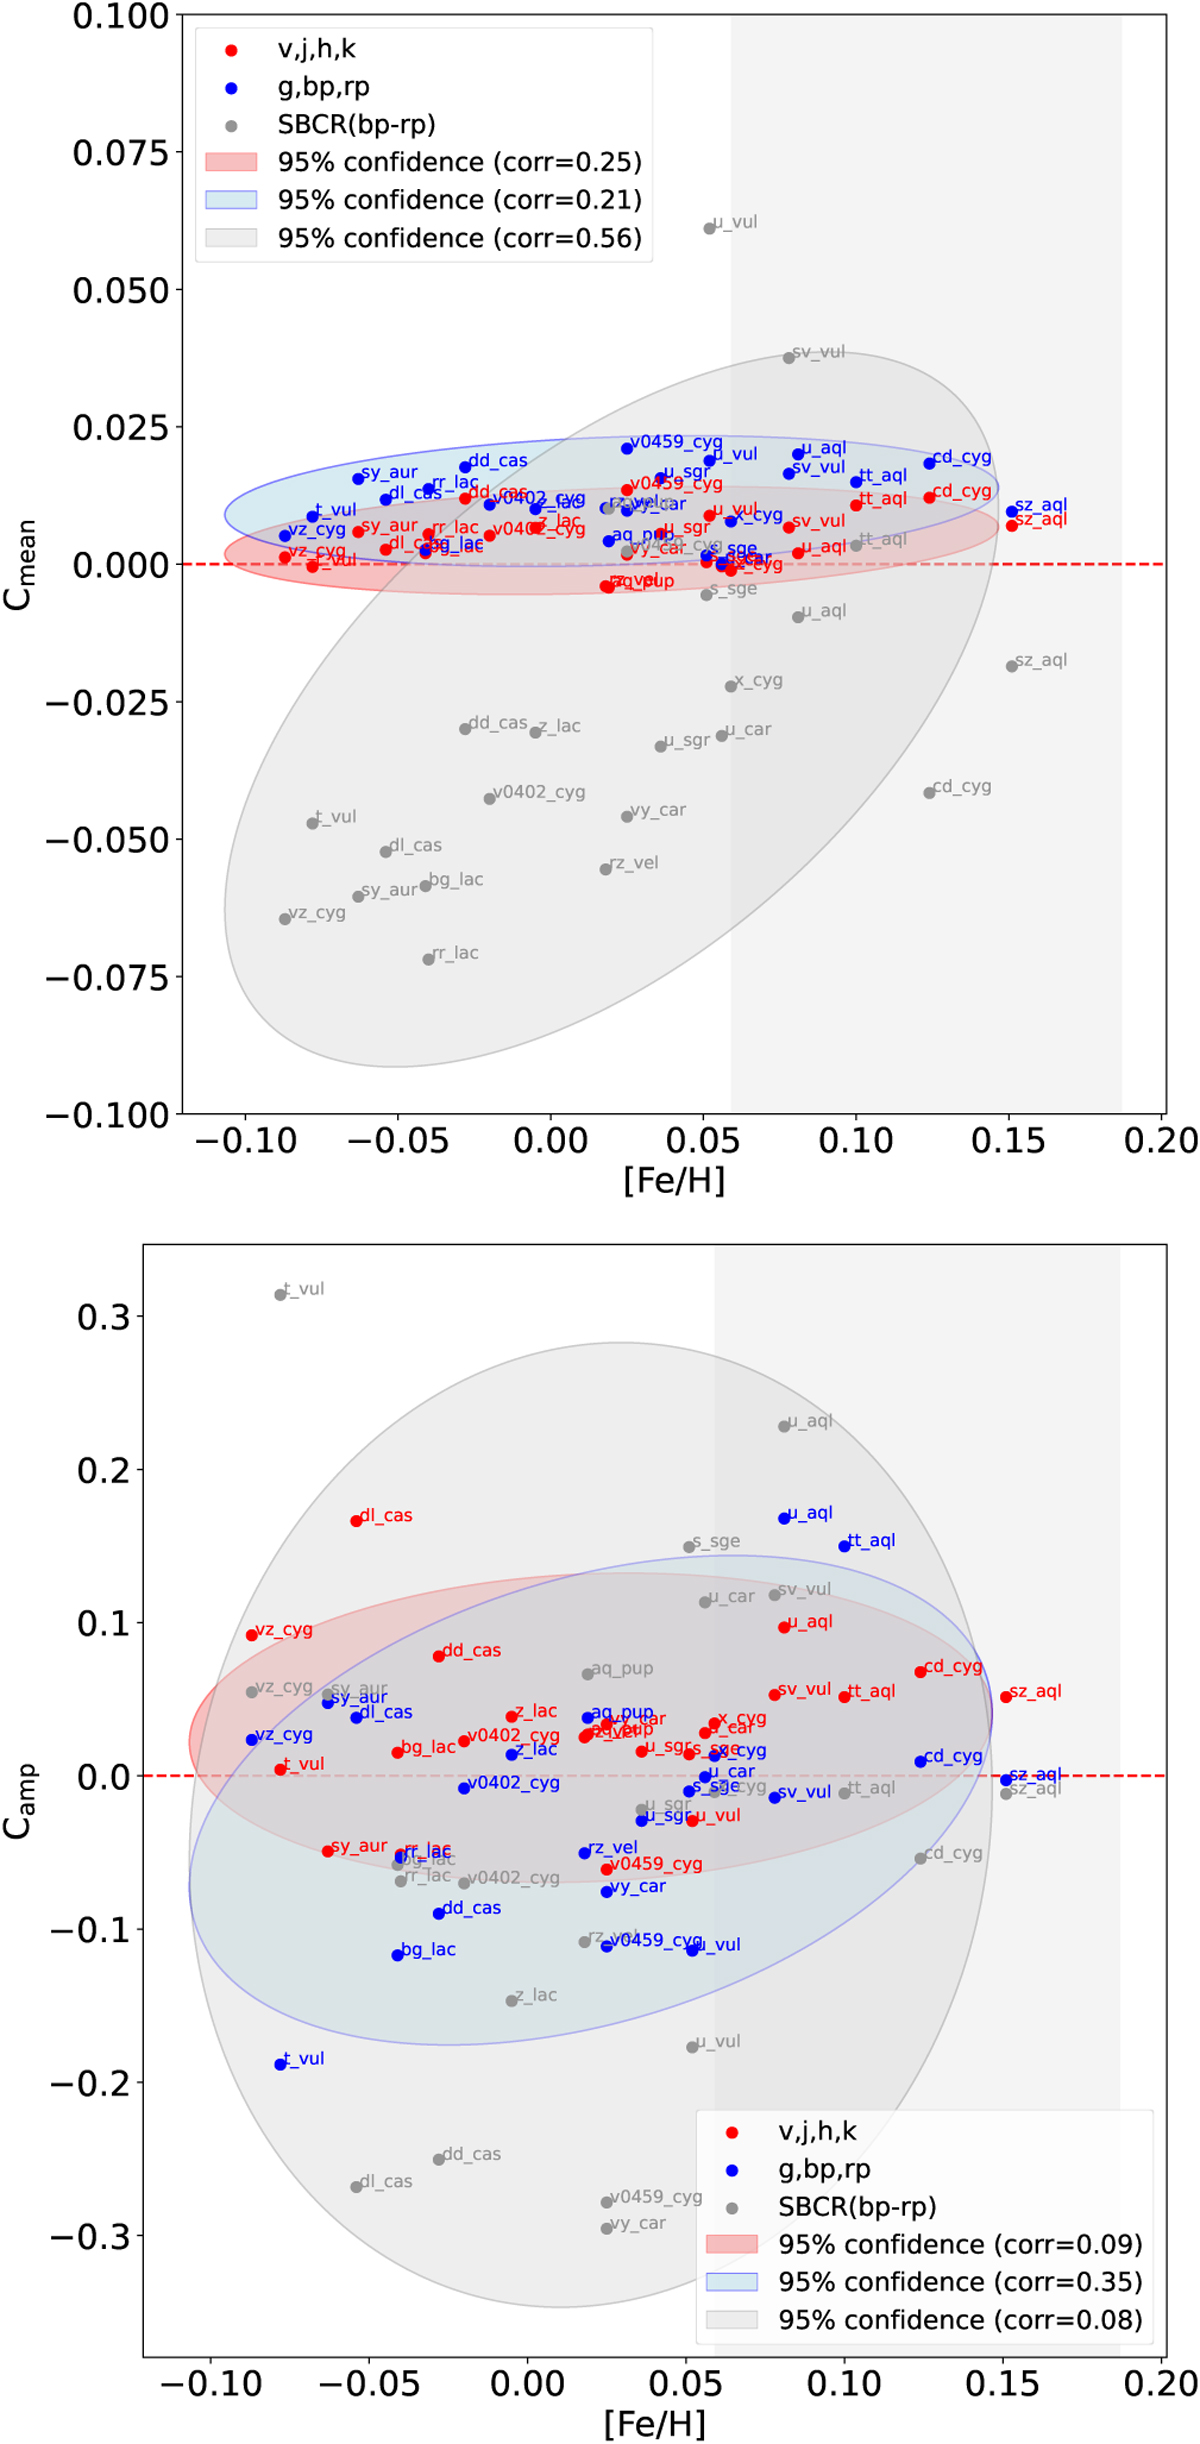
Top: Cmean (see Eq. (18)) is plotted as function of the metallicity. Cmean corresponds to the mean differences obtained with the different SBCRs (θ0(i)) and the mean angular diameter obtained with the SBCR (FV, V − K), θ0(V, K), expressed as a percentage of θ0(V, K). Bottom: Same but considering the amplitudes (see Eq. (19)). The confidence ellipse of the covariance (the ellipse enclose 95% of the points) is plotted in the figure, with the corresponding degree of correlation between the two parameters indicated in the legend. The vertical grey band corresponds to the metallicity of the stars in our sample used to calibrate the SBCRs.
Current usage metrics show cumulative count of Article Views (full-text article views including HTML views, PDF and ePub downloads, according to the available data) and Abstracts Views on Vision4Press platform.
Data correspond to usage on the plateform after 2015. The current usage metrics is available 48-96 hours after online publication and is updated daily on week days.
Initial download of the metrics may take a while.