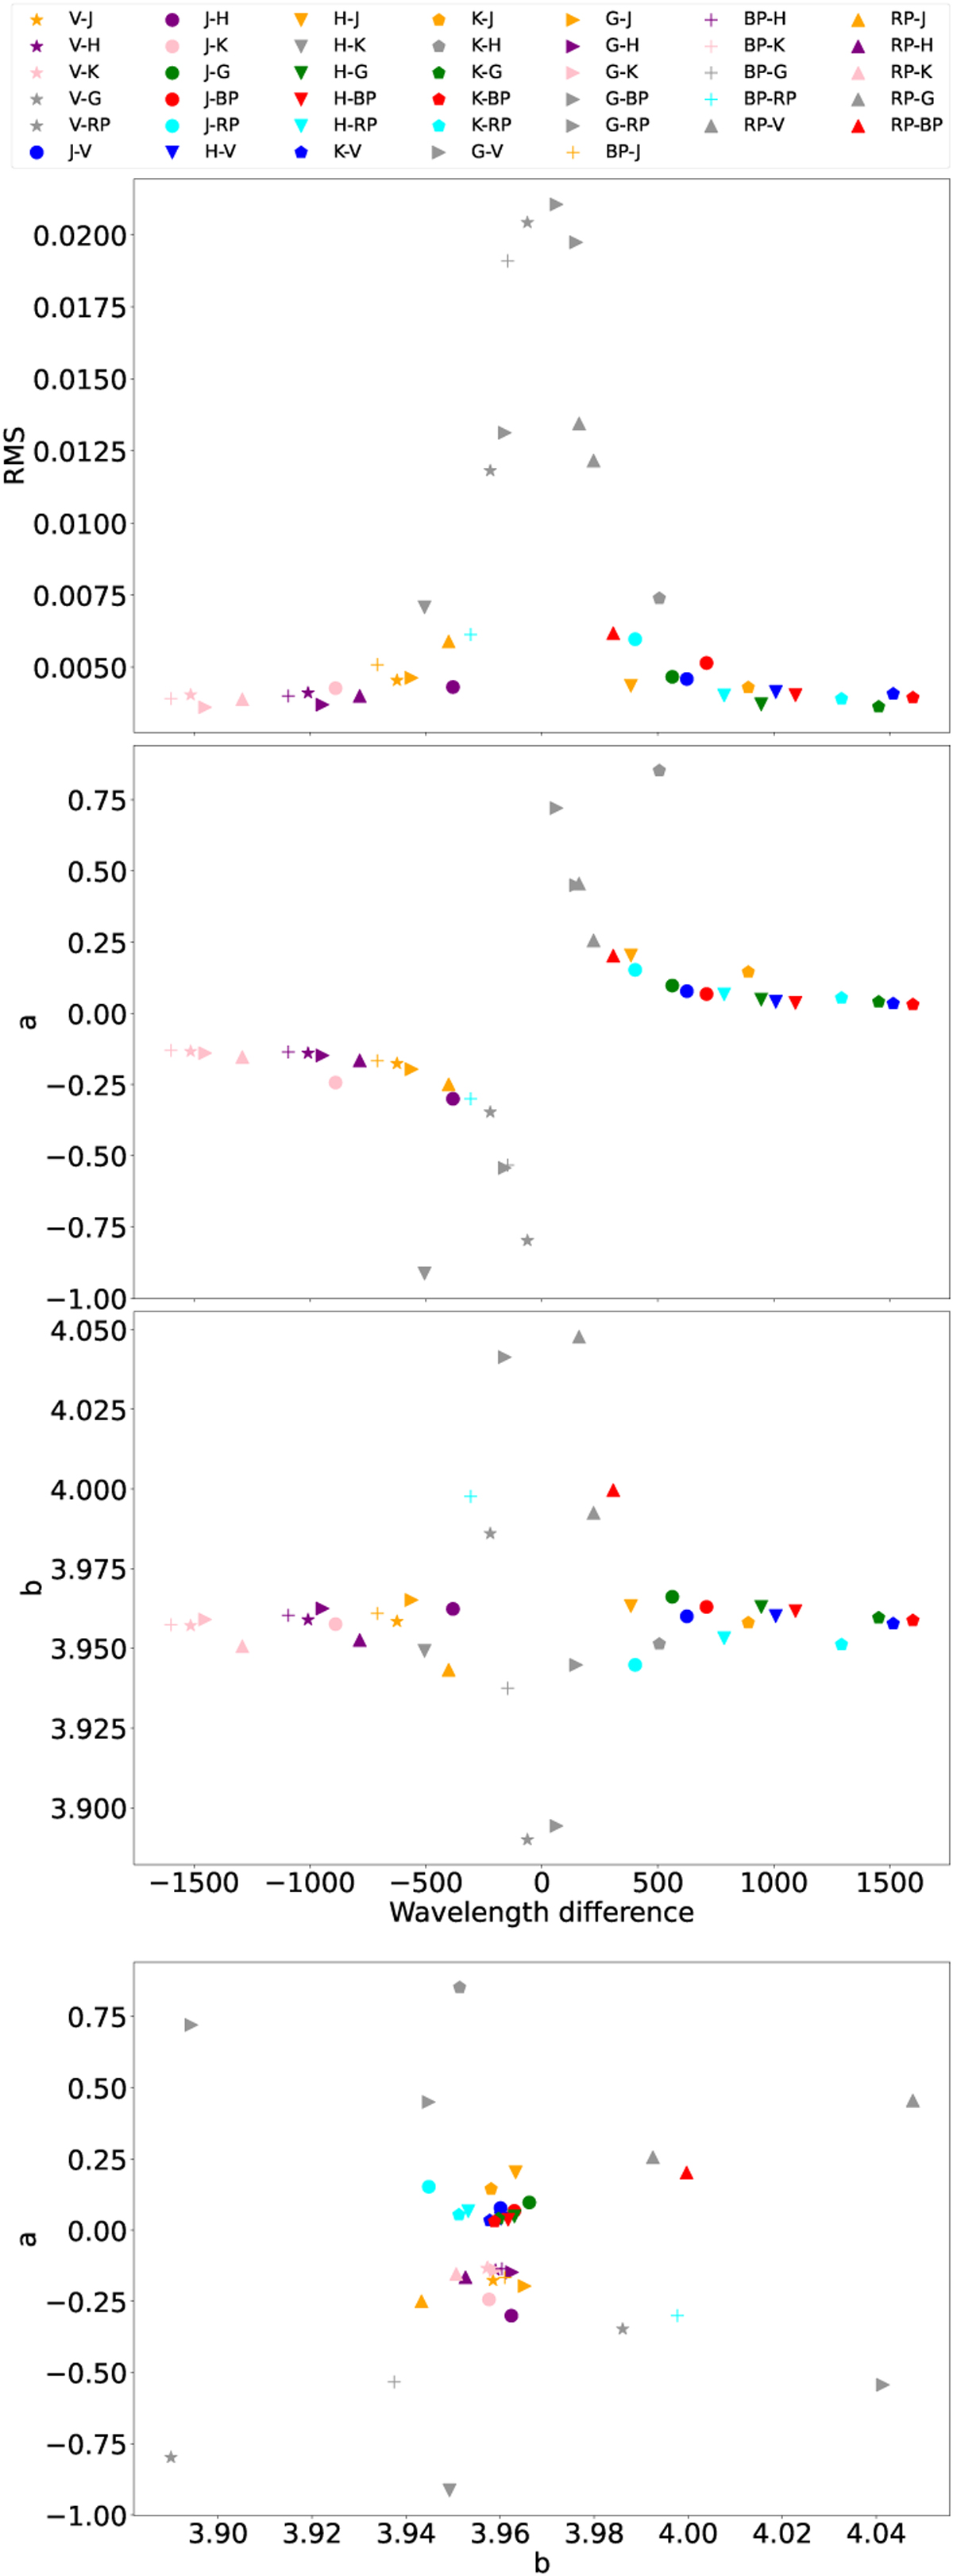
Fig. 10
Download original image
RMS, slope, and zero point of the different SBCRs presented in Table A.1. The first three figures show the RMS (top left), slope (top right), and zero point (bottom left) as a function of the mean wavelength difference between the two passbands used to calculate the colour of the SBCR. The figure at the bottom right shows the slope as a function of the zero point. In grey are indicated the rejected SBCRs. For the sake of clarity, SBCRs with an RMS greater than 0.04 have been removed from the figures.
Current usage metrics show cumulative count of Article Views (full-text article views including HTML views, PDF and ePub downloads, according to the available data) and Abstracts Views on Vision4Press platform.
Data correspond to usage on the plateform after 2015. The current usage metrics is available 48-96 hours after online publication and is updated daily on week days.
Initial download of the metrics may take a while.