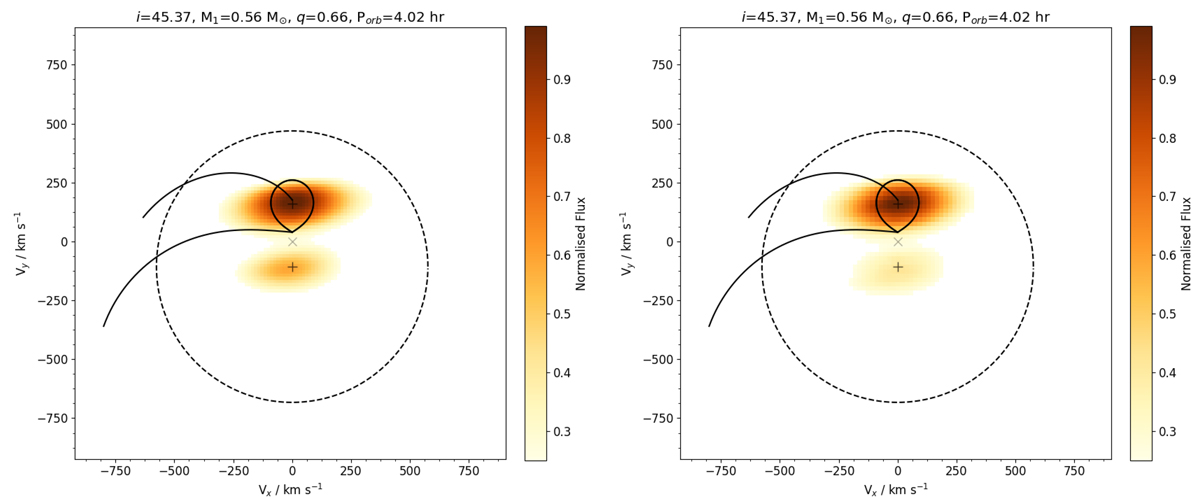
Fig. 4.
Download original image
Doppler tomography of Balmer lines from the Keck observations. The positions of the primary and secondary are indicated by plus signs (+), and the center of mass of the system is labeled by a “x” mark. The solid lines represent the Roche lobe of the secondary and the stream trajectory. Color scales indicate the normalized flux. The dashed line represents the radius of the tidal limit of the accretion disk. Left: Tomography of Hα lines. Right: Tomography of Hβ lines.
Current usage metrics show cumulative count of Article Views (full-text article views including HTML views, PDF and ePub downloads, according to the available data) and Abstracts Views on Vision4Press platform.
Data correspond to usage on the plateform after 2015. The current usage metrics is available 48-96 hours after online publication and is updated daily on week days.
Initial download of the metrics may take a while.