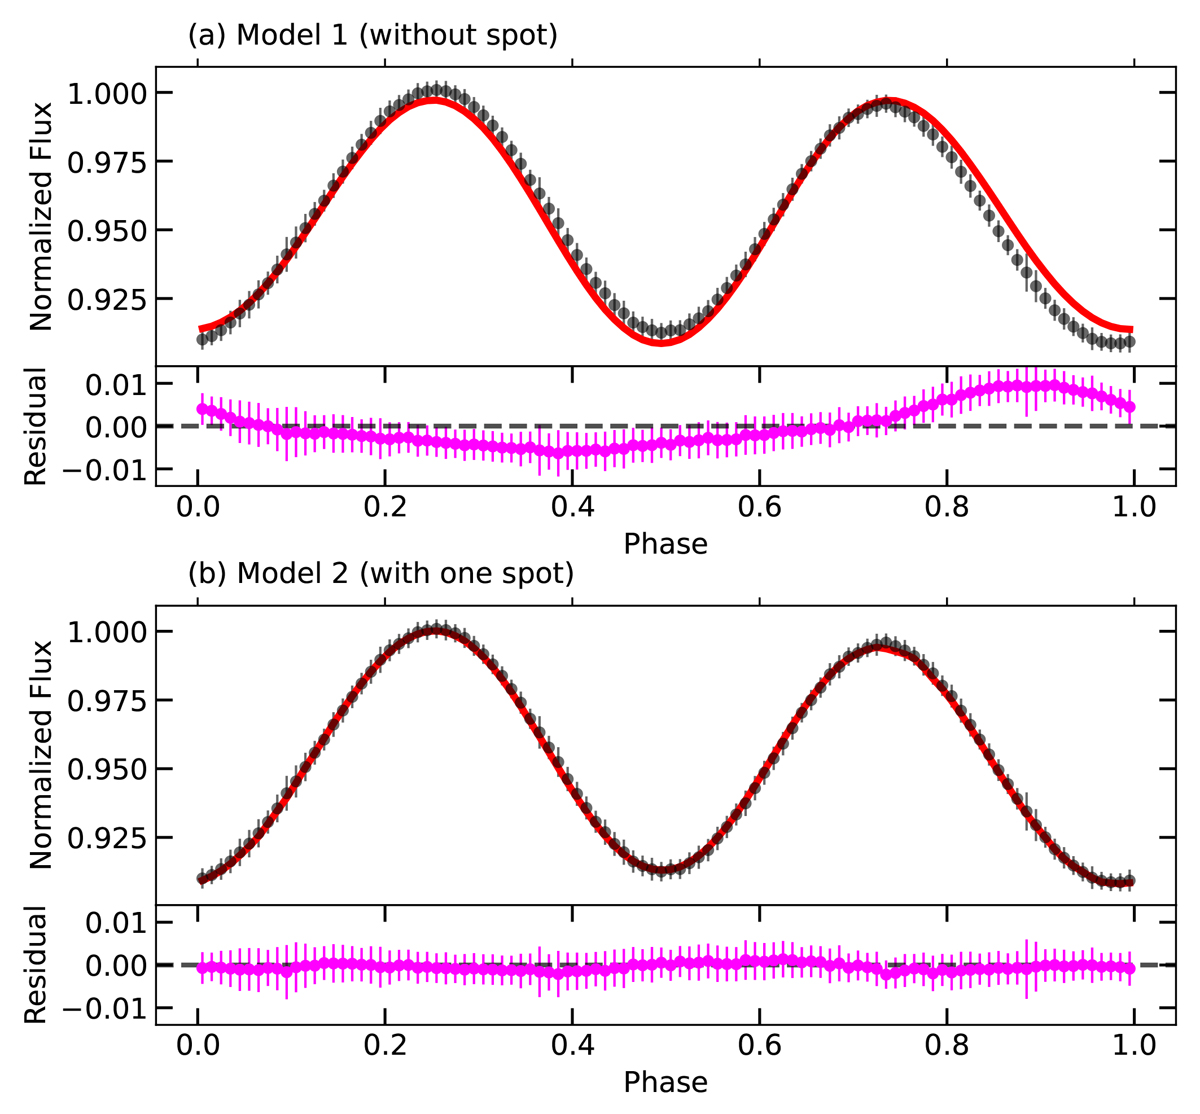
Fig. 3.
Download original image
Upper panel: Black points are the observed TESS light curve evenly divided into 100 phase bins. The error bars display the standard deviations of the bins. The red lines are theoretical light curves calculated by PHOEBE. Lower panel: Residuals between the observed and theoretical light curves. The error bars are the same as those in the upper panel.
Current usage metrics show cumulative count of Article Views (full-text article views including HTML views, PDF and ePub downloads, according to the available data) and Abstracts Views on Vision4Press platform.
Data correspond to usage on the plateform after 2015. The current usage metrics is available 48-96 hours after online publication and is updated daily on week days.
Initial download of the metrics may take a while.