Open Access
Fig. 2.
Download original image
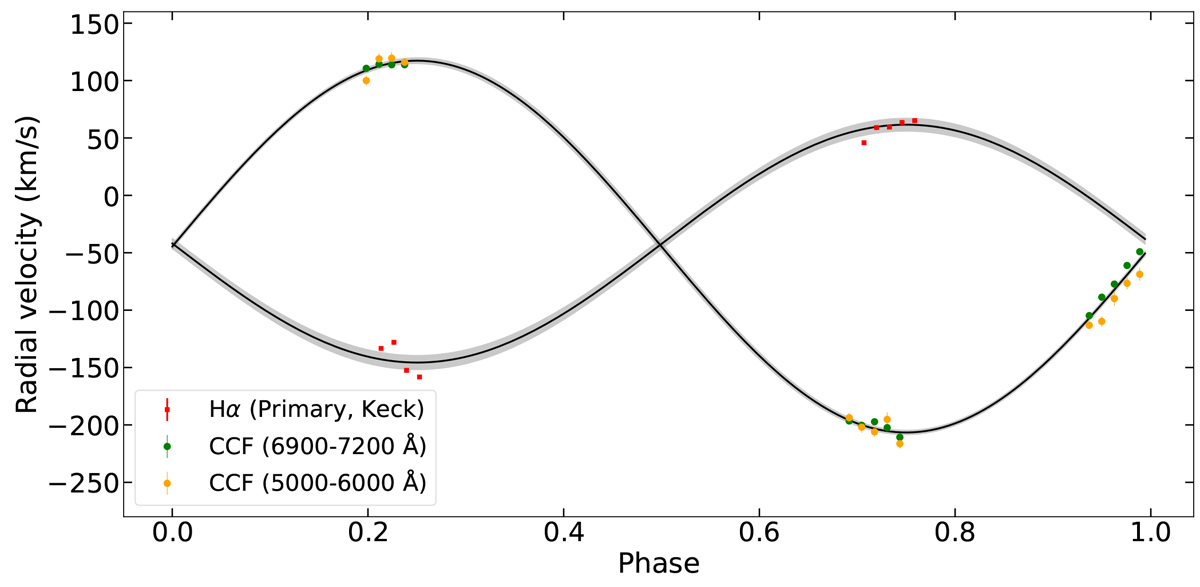
RV curves as a function of orbital phase. The black lines are the best-fit sinusoidal function for the Keck RV data from the CCF. The gray shaded region represents the 1σ posterior spread. Orange and green dots represent RVs from the CCF method. Red squares represent RVs measured from Hα lines.
Current usage metrics show cumulative count of Article Views (full-text article views including HTML views, PDF and ePub downloads, according to the available data) and Abstracts Views on Vision4Press platform.
Data correspond to usage on the plateform after 2015. The current usage metrics is available 48-96 hours after online publication and is updated daily on week days.
Initial download of the metrics may take a while.