Fig. 8
Download original image
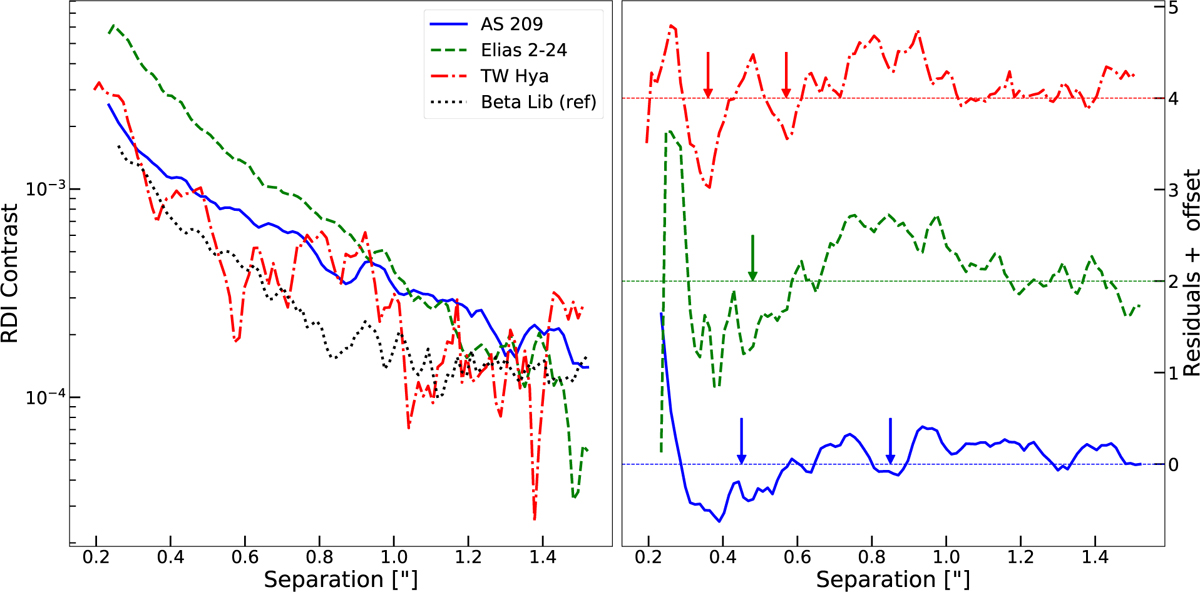
Left: radial profiles after RDI of TW Hya, AS 209, Elias 2-24, and the reference star β Lib in logarithmic scale. The profiles were computed from RDI data. Separation is expressed in arcseconds, and the flux is normalized to the stellar peak intensity. Right: residuals of the radial profiles after exponential fitting, with an incremental offset of 2 applied to each curve to avoid overlap. A dashed line indicates the new zero level of the residuals and the arrows indicate the observed gaps.
Current usage metrics show cumulative count of Article Views (full-text article views including HTML views, PDF and ePub downloads, according to the available data) and Abstracts Views on Vision4Press platform.
Data correspond to usage on the plateform after 2015. The current usage metrics is available 48-96 hours after online publication and is updated daily on week days.
Initial download of the metrics may take a while.