Open Access
Fig. 7
Download original image
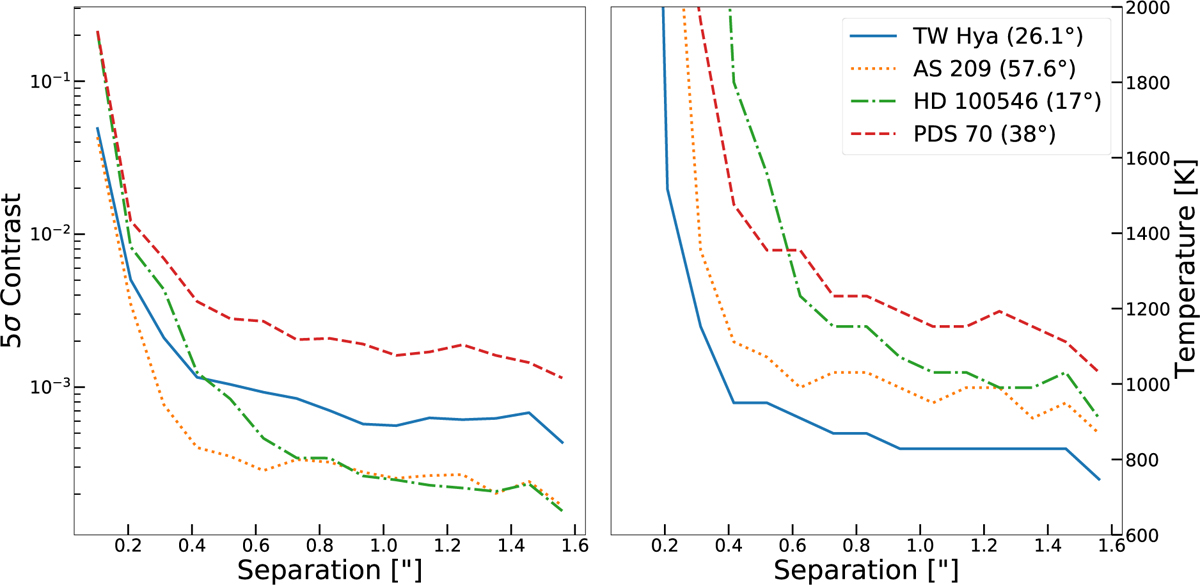
Left: contrast curves for the various targets. A dependency between contrast and field rotation is visible. PSD 70 deviates from this trend as it is the faintest star in our sample. Right: planet temperature upper limit curves (Rp = 2 RJup) for the four targets.
Current usage metrics show cumulative count of Article Views (full-text article views including HTML views, PDF and ePub downloads, according to the available data) and Abstracts Views on Vision4Press platform.
Data correspond to usage on the plateform after 2015. The current usage metrics is available 48-96 hours after online publication and is updated daily on week days.
Initial download of the metrics may take a while.