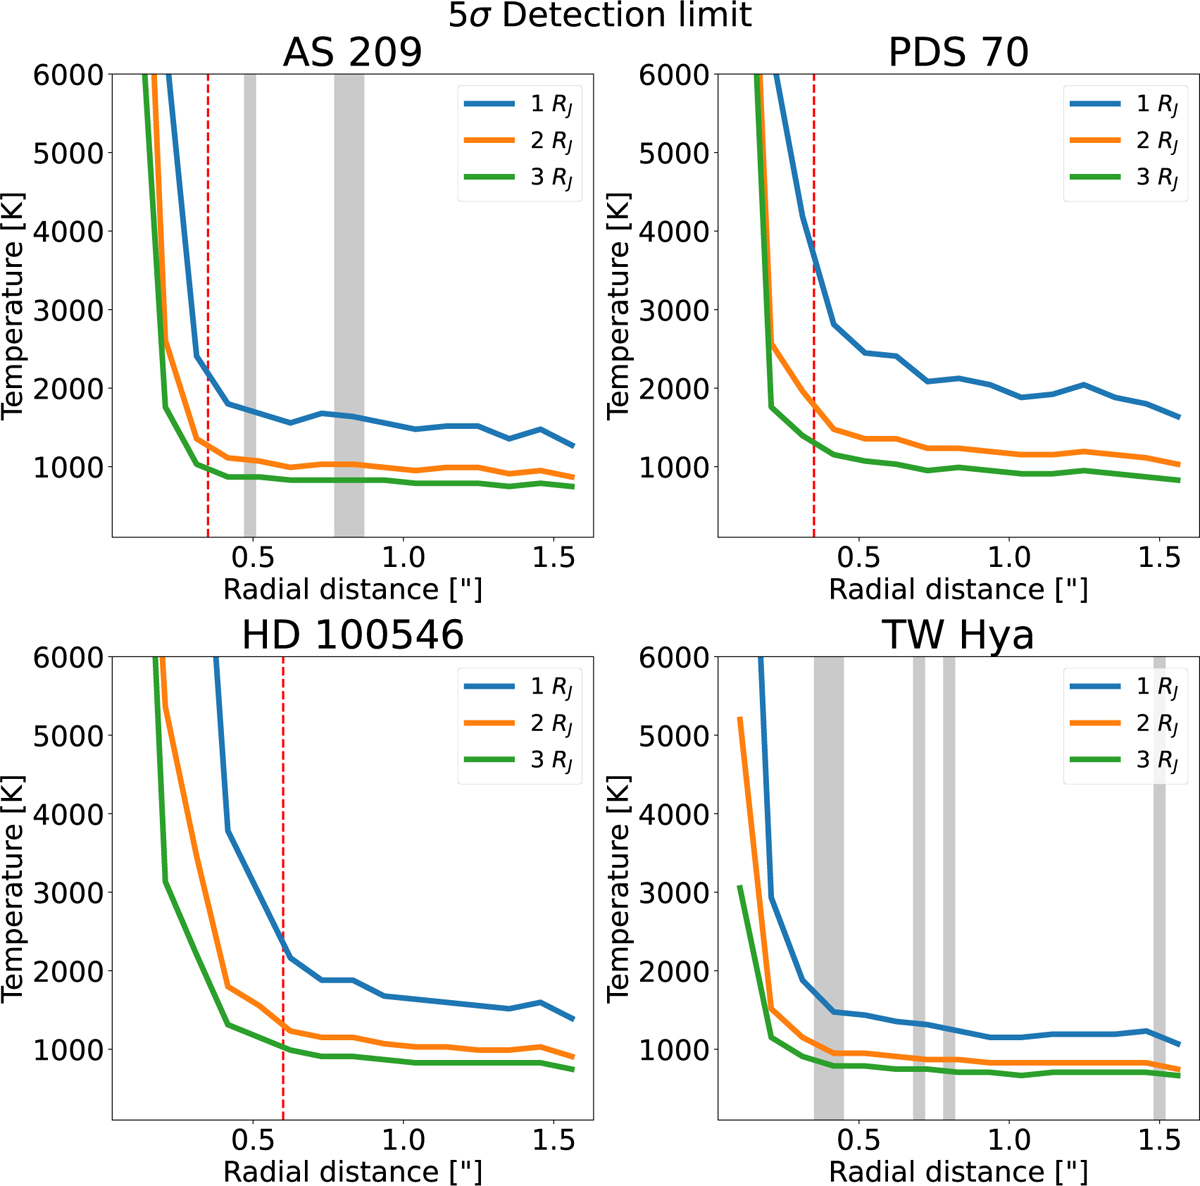
Fig. F.26
Download original image
Minimum detectable temperature plots for the three selected planetary radii, shown for stars with rotation angles greater than 10 degrees. The vertical gray bands represent the position of gaps in the disk, while the vertical dashed red line indicates the angular distance within which disk residuals influenced the contrast curve.
Current usage metrics show cumulative count of Article Views (full-text article views including HTML views, PDF and ePub downloads, according to the available data) and Abstracts Views on Vision4Press platform.
Data correspond to usage on the plateform after 2015. The current usage metrics is available 48-96 hours after online publication and is updated daily on week days.
Initial download of the metrics may take a while.