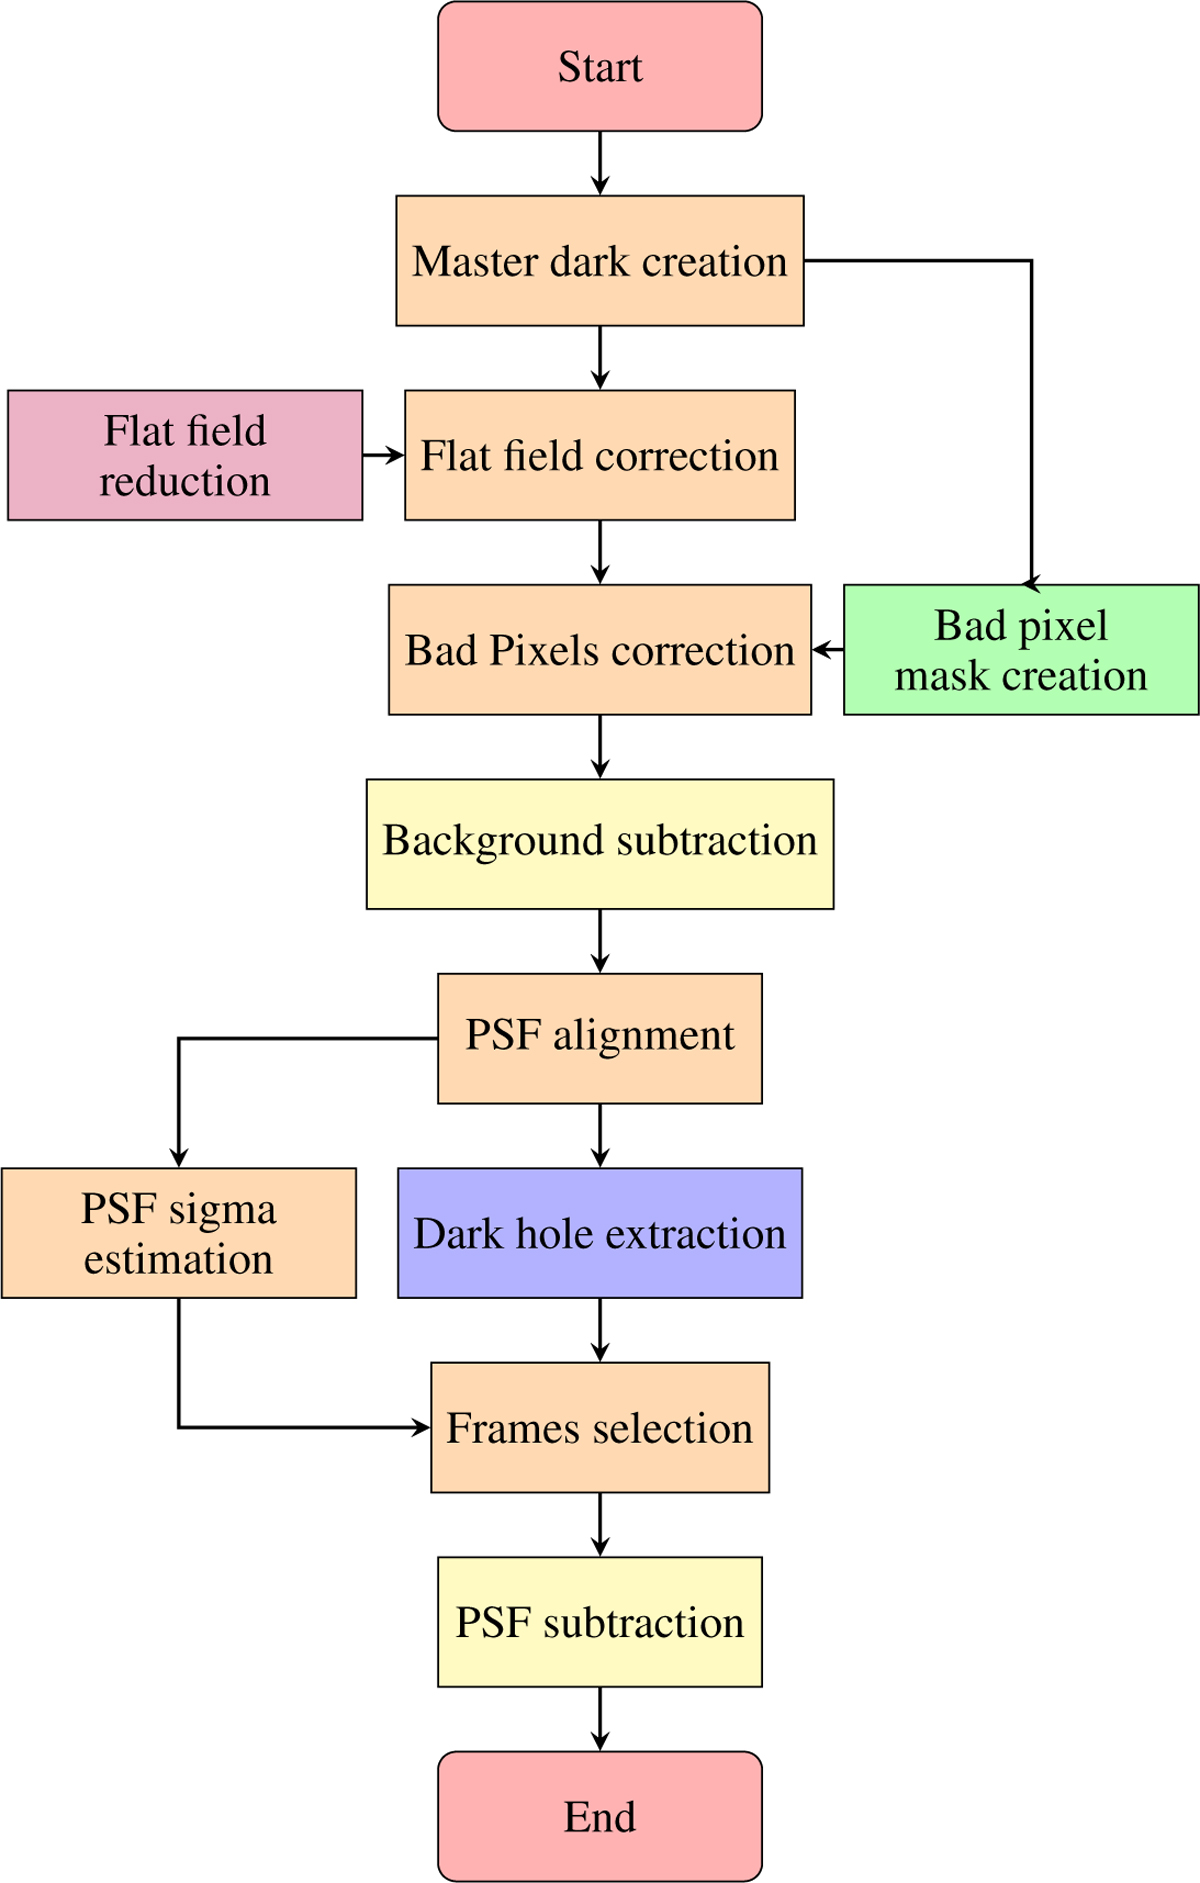
Fig. A.13

Download original image
Flowchart of the data reduction procedure. Parallel processes are represented as side branches. Colors indicate the following: orange for operations applied to individual frames in the datacube, yellow for operations that collapse the entire cube into a single frame (mean or median), purple for operations involving two datacubes, and green for operations using standard calibration data provided by ESO.
Current usage metrics show cumulative count of Article Views (full-text article views including HTML views, PDF and ePub downloads, according to the available data) and Abstracts Views on Vision4Press platform.
Data correspond to usage on the plateform after 2015. The current usage metrics is available 48-96 hours after online publication and is updated daily on week days.
Initial download of the metrics may take a while.


