Open Access
Fig. 10
Download original image
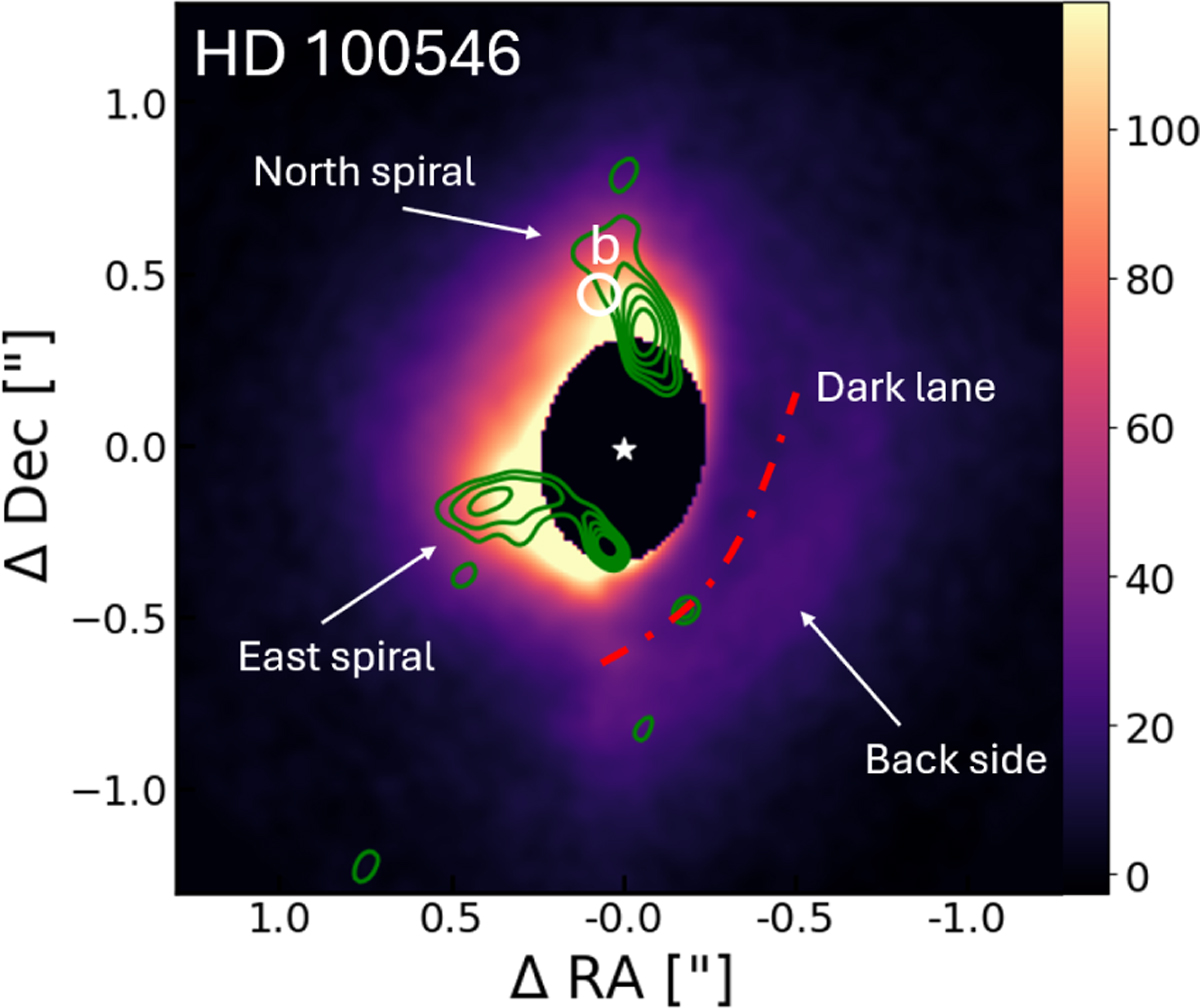
Comparison of structures visible around HD 100546 with RDI and ADI-PCA techniques. The position of “b” indicated in the image refers to the candidate of Quanz et al. (2015). The green contours represent the signal observed in the ADI-PCA.
Current usage metrics show cumulative count of Article Views (full-text article views including HTML views, PDF and ePub downloads, according to the available data) and Abstracts Views on Vision4Press platform.
Data correspond to usage on the plateform after 2015. The current usage metrics is available 48-96 hours after online publication and is updated daily on week days.
Initial download of the metrics may take a while.