Fig. 9.
Download original image
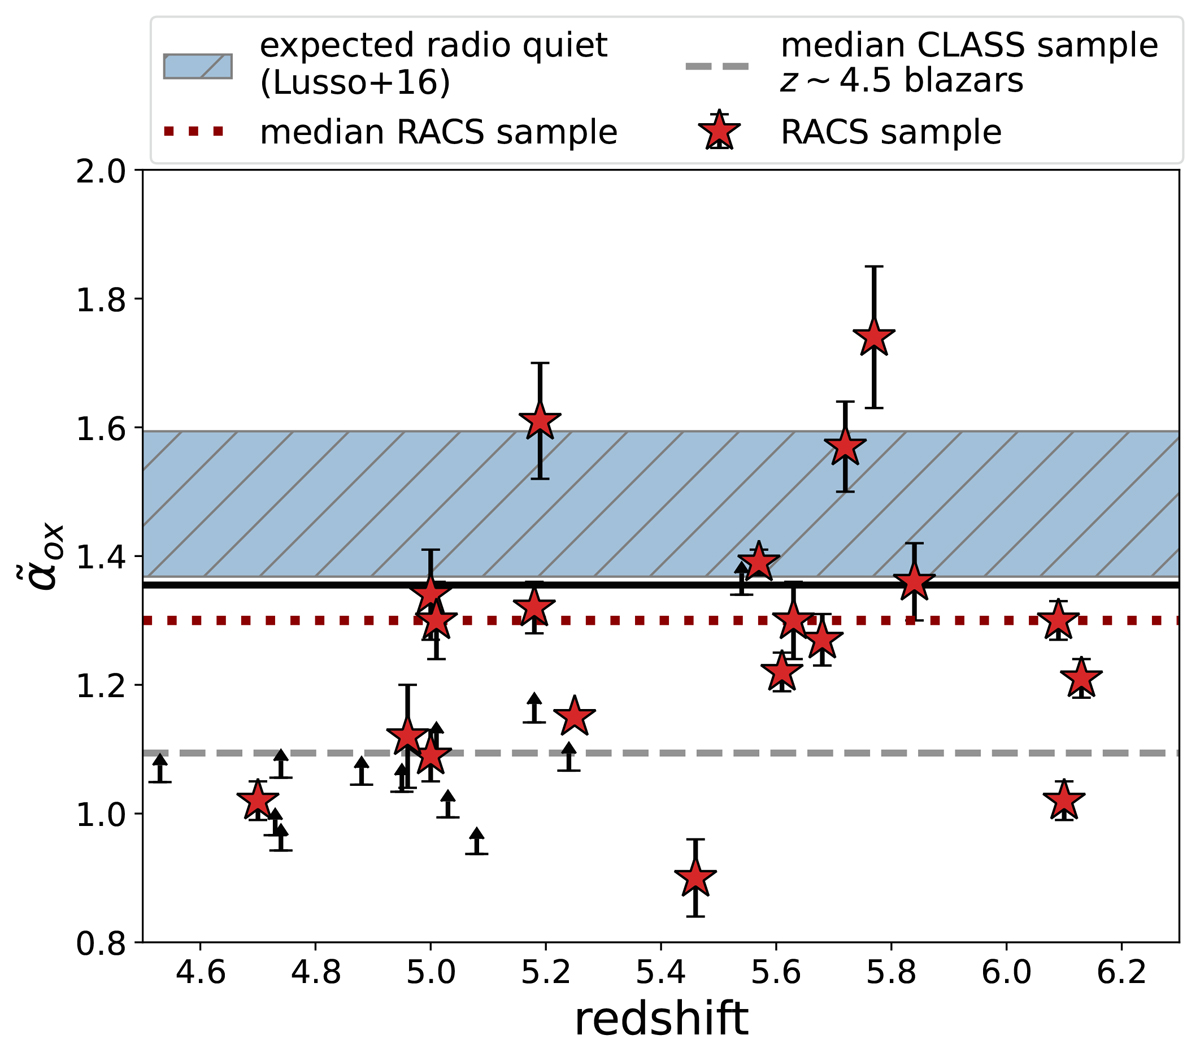
X-ray-to-UV relative emission (![]() parameter) of the RACS sources with X-ray coverage as a function of their redshift. The dotted red line shows the median value of the RACS sources with an X-ray detection, while the dashed grey line is the median value of the blazar sample analysed in Ighina et al. (2019). The dashed blue area showed range of values expected from the X-ray corona (i.e. from a radio-quiet quasar) with a monochromatic UV luminosity similar to the RACS sample, log
parameter) of the RACS sources with X-ray coverage as a function of their redshift. The dotted red line shows the median value of the RACS sources with an X-ray detection, while the dashed grey line is the median value of the blazar sample analysed in Ighina et al. (2019). The dashed blue area showed range of values expected from the X-ray corona (i.e. from a radio-quiet quasar) with a monochromatic UV luminosity similar to the RACS sample, log![]() erg s−1 Hz−1, based on the relation described in Lusso & Risaliti (2016) and assuming a photon index in the range Γ = 1.7 − 2.1.
erg s−1 Hz−1, based on the relation described in Lusso & Risaliti (2016) and assuming a photon index in the range Γ = 1.7 − 2.1.
Current usage metrics show cumulative count of Article Views (full-text article views including HTML views, PDF and ePub downloads, according to the available data) and Abstracts Views on Vision4Press platform.
Data correspond to usage on the plateform after 2015. The current usage metrics is available 48-96 hours after online publication and is updated daily on week days.
Initial download of the metrics may take a while.