Fig. 8.
Download original image
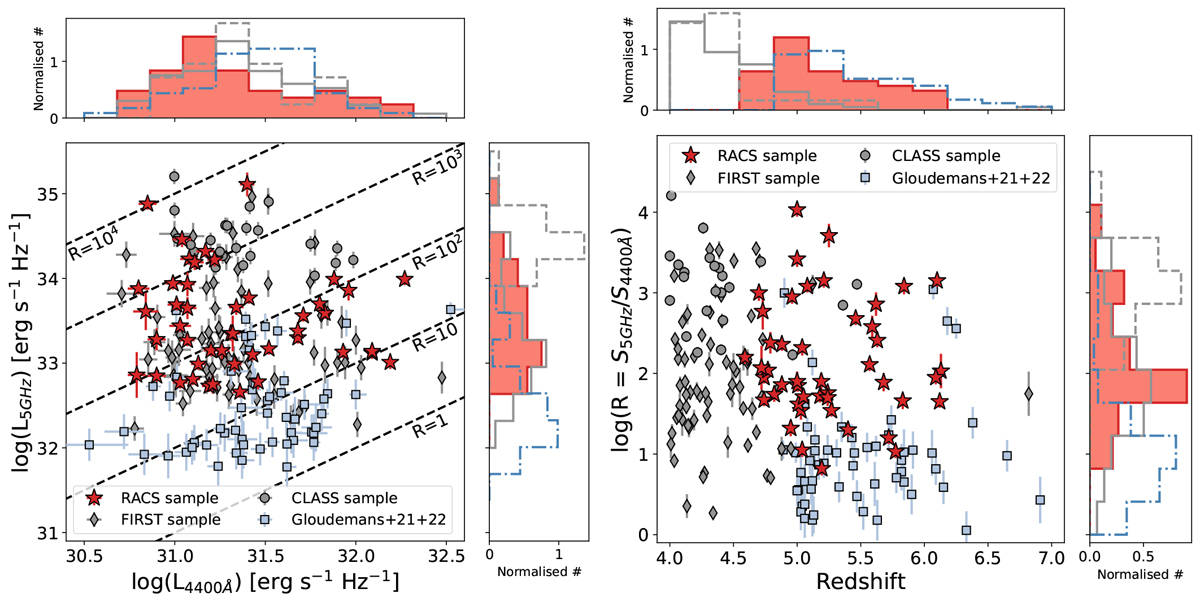
Left panel: Radio (5 GHz) and optical (4400 Å) monochromatic luminosity distributions of the high-z sample selected with RACS. The sample includes the new high-z quasars discovered during this project as well as the z > 5 radio quasar already reported in the literature. The newly discovered quasars at z < 5 are reported in light blue, whereas the remaining z > 5 RACS quasars are reported in dark blue. Grey diamonds and circles indicate the FIRST sample described in Caccianiga et al. (2024) and the CLASS sample described in Caccianiga et al. (2019), respectively. The light-blue squares are the high-z radio quasars detected in LoTSS (from Gloudemans et al. 2021, 2022). Right panel: Radio loudness, R = S5 GHz/S4400 Å, and redshift distribution of the RACS, LoTSS, FIRST and CLASS samples. The symbols are the same as in the left panel. The histograms in both panels show the distribution of the given parameter for each sample (CLASS = dashed, FIRST = solid empty, LoTSS = dashed-dotted and RACS = filled histogram).
Current usage metrics show cumulative count of Article Views (full-text article views including HTML views, PDF and ePub downloads, according to the available data) and Abstracts Views on Vision4Press platform.
Data correspond to usage on the plateform after 2015. The current usage metrics is available 48-96 hours after online publication and is updated daily on week days.
Initial download of the metrics may take a while.