Fig. 7.
Download original image
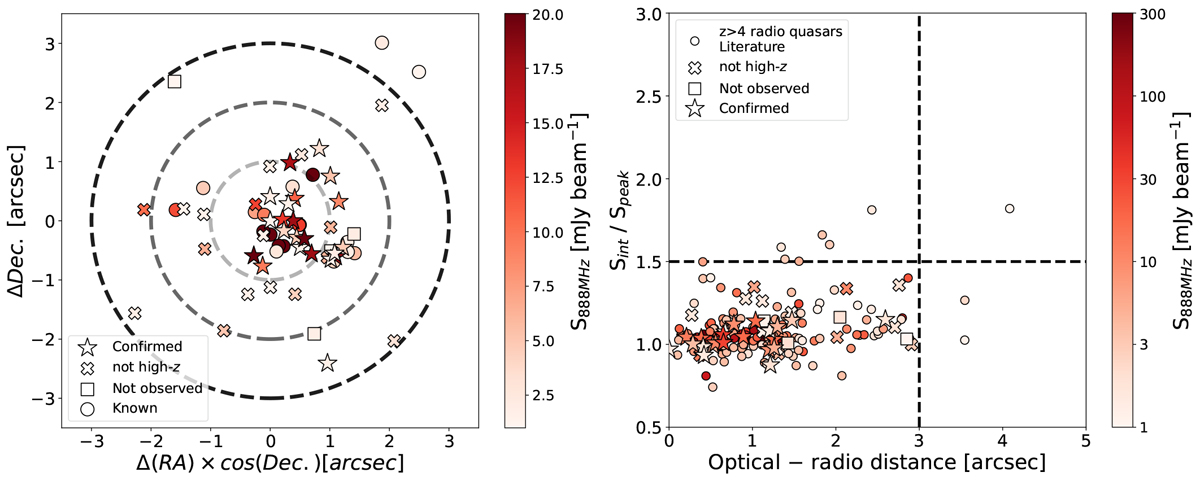
Left panel: Offset in declination as a function of the offset in right ascension between the optical positions from DES or Pan-STARRS and the radio positions from RACS-low for the high-z candidates as well as the already known z > 5 radio quasars with the same flux limits. The colour of the data points reflects the peak flux density of the given source in the RACS-low source lists as shown by the colour-bar. The dashed circles represent a separation of 1, 2 and 3″. Right panel: Distribution of the integrated-to-peak flux density ratios from RACS-low as a function of the optical-to-RACS position for the z > 4 radio quasars currently known in the RACS area. The colour of the markers indicates the peak flux density reported in the RACS-low source lists. The dashed black line are the threshold used during our selection.
Current usage metrics show cumulative count of Article Views (full-text article views including HTML views, PDF and ePub downloads, according to the available data) and Abstracts Views on Vision4Press platform.
Data correspond to usage on the plateform after 2015. The current usage metrics is available 48-96 hours after online publication and is updated daily on week days.
Initial download of the metrics may take a while.