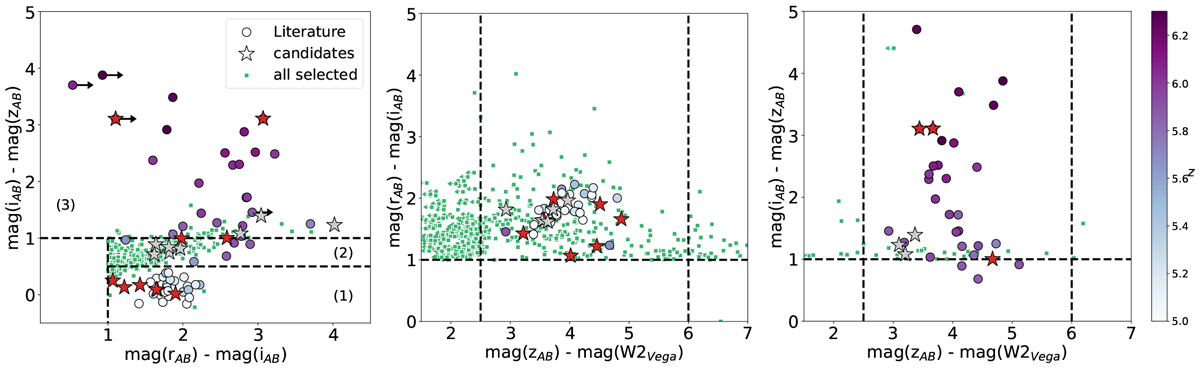
Fig. 3.
Download original image
Colour plots used for the selection of candidates from the DES survey. In all the plots the circles represent the already known z > 5 quasars in the DES area, colour coded based on their redshift. The dashed lines represent the threshold considered in our selection. The small green squares are all the potential candidates selected with the criteria reported in Fig. 2, without the visual inspection of the g-band images. Stars indicate the candidates that satisfied all the selection criteria and that form the final well-defined sample: red for confirmed high-z quasars and grey for not-confirmed candidates. Left panel: Colour of i − z as a function of the colour of r − i. The plot is divided into three regions, for which different sets of criteria were applied (see Fig. 2), with the aim of selecting sources in specific redshift ranges. As clear from this plot, the region (2) is the one with the most contaminates, likely stars with a spurious radio association. Central panel: Colour of z − W2 as a function of the one around the r − i drop. Right panel: Colour of z − W2 as a function of the one around the i − z drop. The W2 magnitude is the only one in the Vega system. The rest are in the AB system. For sources not detected in the W2 band, we adopted an upper limit of magW2 = 19.
Current usage metrics show cumulative count of Article Views (full-text article views including HTML views, PDF and ePub downloads, according to the available data) and Abstracts Views on Vision4Press platform.
Data correspond to usage on the plateform after 2015. The current usage metrics is available 48-96 hours after online publication and is updated daily on week days.
Initial download of the metrics may take a while.