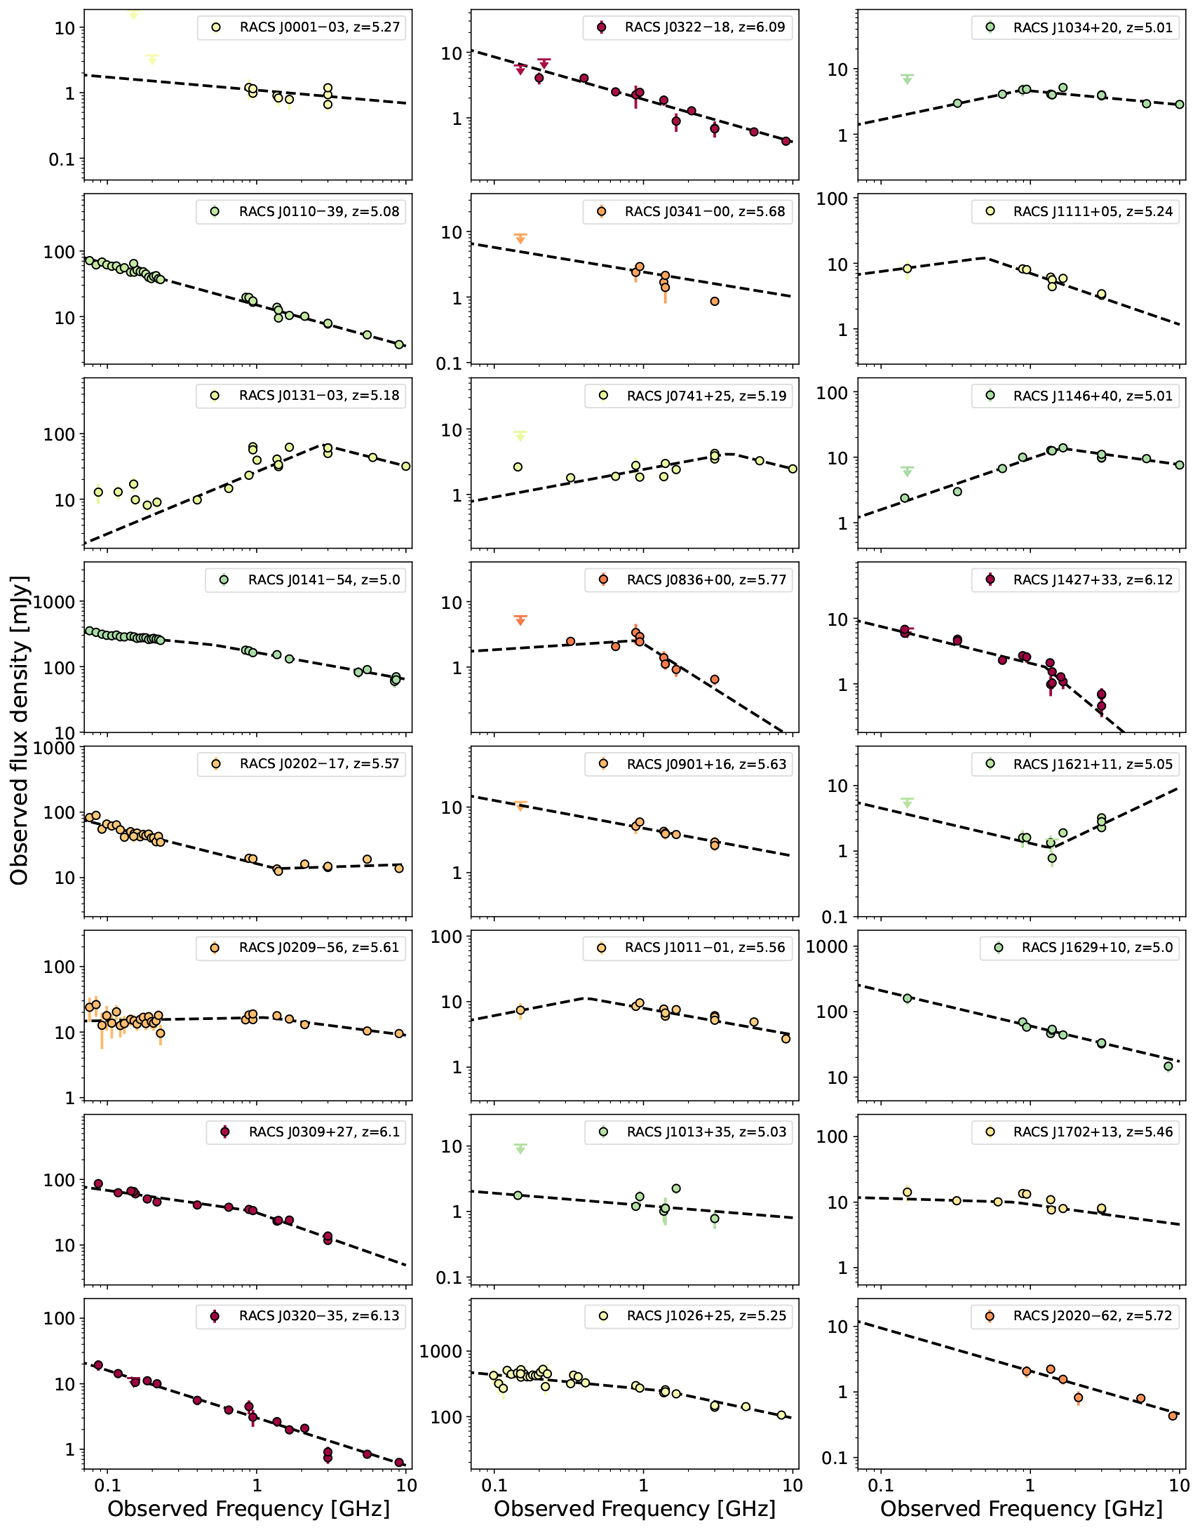
Fig. D.1.
Download original image
Radio spectra of the newly discovered sources in the RACS sample in order of increasing redshift (colour-coded with the same scale of Fig. 6). Radio data points are mainly from publicly available surveys, as described in the text, as well as from dedicated ATCA, uGMRT and MeerKAT observations on a sub-set of objects. The dashed black line show the best-fit power law (or broken power law) function.
Current usage metrics show cumulative count of Article Views (full-text article views including HTML views, PDF and ePub downloads, according to the available data) and Abstracts Views on Vision4Press platform.
Data correspond to usage on the plateform after 2015. The current usage metrics is available 48-96 hours after online publication and is updated daily on week days.
Initial download of the metrics may take a while.