Fig. A.1.
Download original image
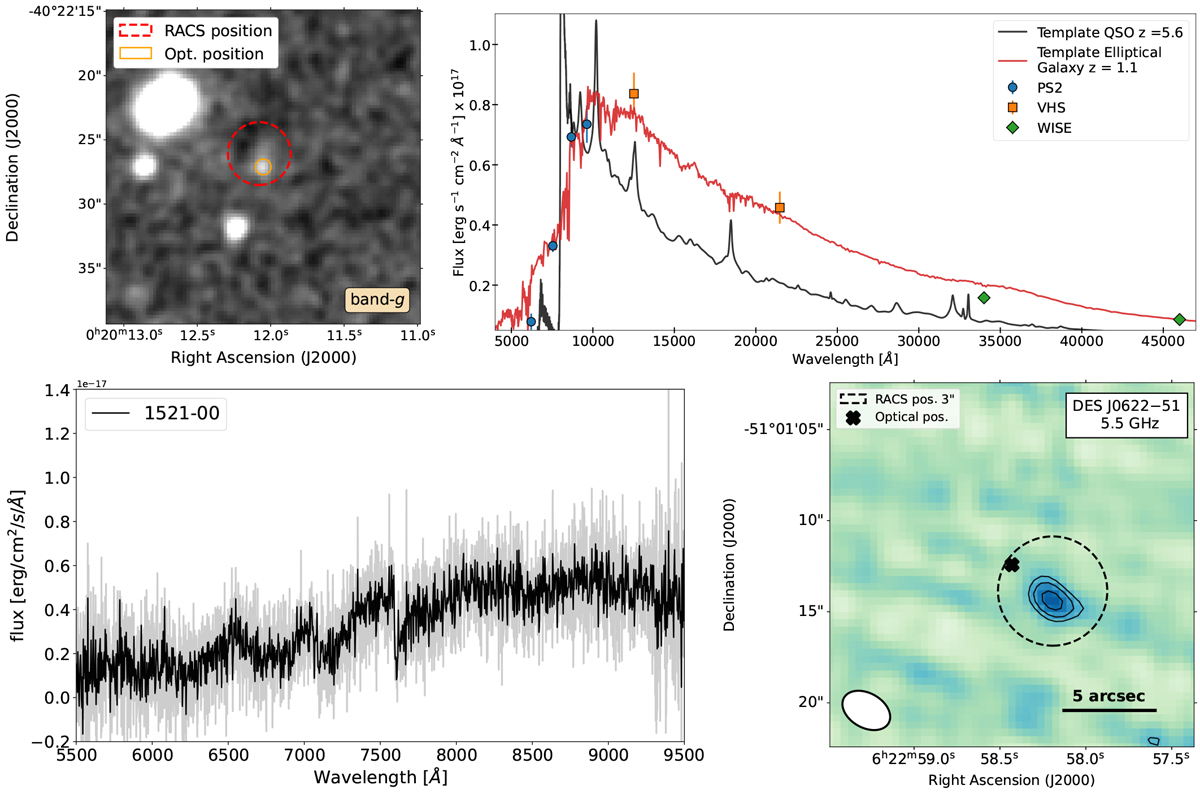
Top-left panel: Example of high-z candidate selected based on the initial optical/IR selections from DES and catWISE, but then discarded after a visual inspection of its g-band image. We note that the image has been smoothed with a Gaussian filter in order to make the faint signals at the position of the optical source more evident. Top-right panel: Example of a selected candidate which was then discarded based on the NIR photometric points (from VHS). The black solid line is a template for high-z quasars and the red solid line is a template for an elliptical galaxy. In this specific case, the source is likely an elliptical galaxy at z ∼ 1.1. Bottom-left panel: Example of the LBT/MODS spectrum of a candidate (RACS J1521−00) not confirmed to be at high redshift. In this specific case, the target is likely a type M brown dwarf. The grey spectrum is at a resolution of ∼0.9 Å, whereas the black one is binned at ∼3.5 Å. Bottom-right panel: ATCA image at 5.5 GHz of RACS J0622−51, a candidate selected based on its optical/NIR colours and a radio association in the RACS-low survey within 3″ (dashed circle). The black cross shows the optical position of the high-z candidate. The radio source detected with the ATCA revealed the RACS-low association to be spurious, with the radio source being > 10σ away from the optical counterpart, with σ = 0.24″ the uncertainty on the ATCA position derived from the fit of the radio source. The black contours in the image are drawn at -3, 3, 3![]() , 6 times the RMS of the image (RMS = 27 μ Jy beam−1).
, 6 times the RMS of the image (RMS = 27 μ Jy beam−1).
Current usage metrics show cumulative count of Article Views (full-text article views including HTML views, PDF and ePub downloads, according to the available data) and Abstracts Views on Vision4Press platform.
Data correspond to usage on the plateform after 2015. The current usage metrics is available 48-96 hours after online publication and is updated daily on week days.
Initial download of the metrics may take a while.