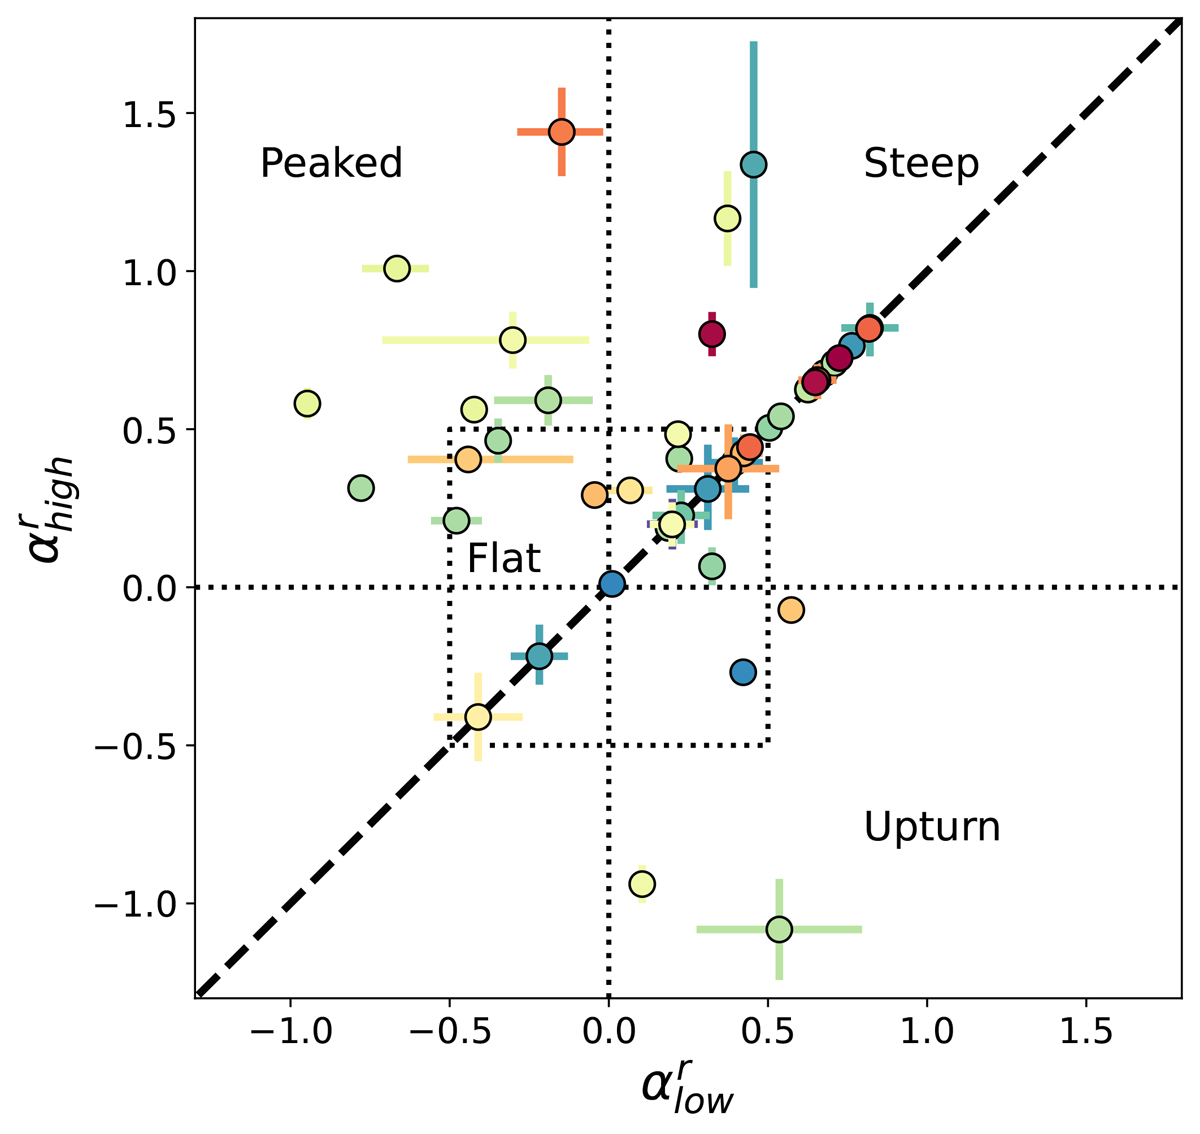
Fig. 12.
Download original image
Low-frequency (αlow) and high-frequency (αhigh) radio spectral indices of the radio quasars discussed in this work. For clarity reasons, we only show values with an uncertainty on both spectral indices σ < 0.7. Sources with a single power law fit are shown on the 1:1 relation (dashed black line). Objects with a single power law fit are reported in this line. The dotted lines at α = 0, ±0.5 divide the space in different regions, as discussed in the text.
Current usage metrics show cumulative count of Article Views (full-text article views including HTML views, PDF and ePub downloads, according to the available data) and Abstracts Views on Vision4Press platform.
Data correspond to usage on the plateform after 2015. The current usage metrics is available 48-96 hours after online publication and is updated daily on week days.
Initial download of the metrics may take a while.