Fig. 11.
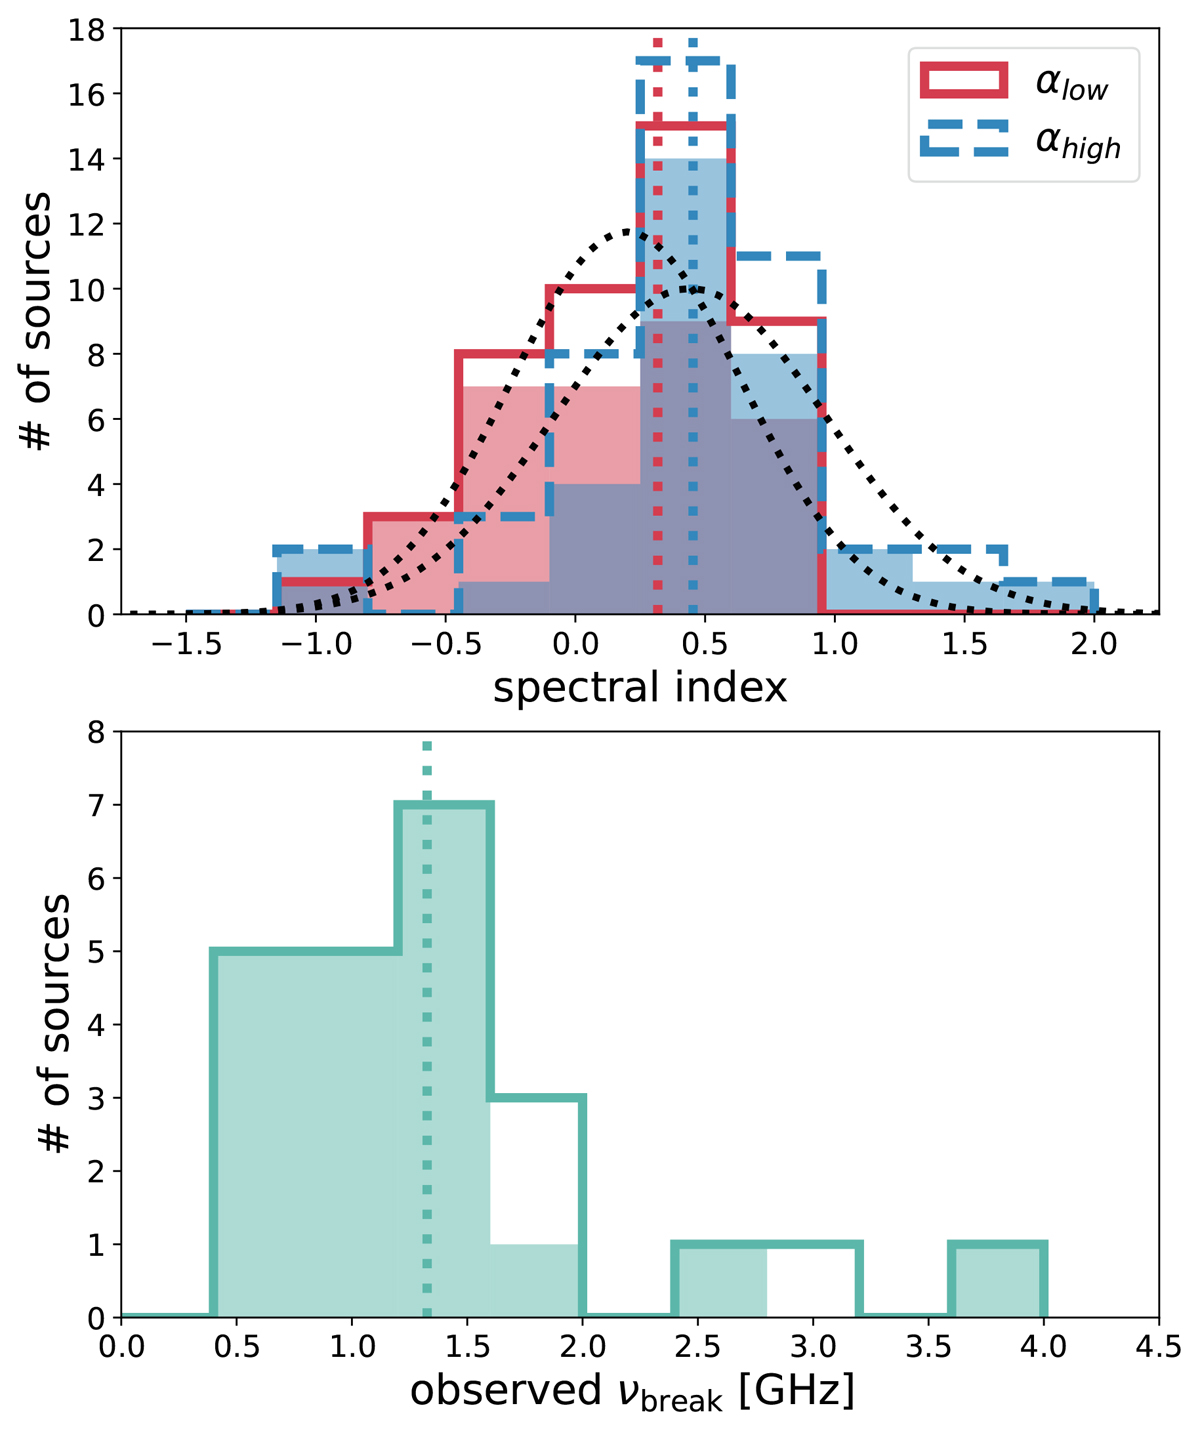
Download original image
Top panel: Distribution of the αlow and αhigh parameters derived for all the radio quasars discussed in this work. In case of a single power law fit, the spectral index is considered in both distributions. Dotted vertical lines indicate the median values of each spectral index distribution (0.32 and 0.45 for αlow and αhigh, respectively). The best-fit Gaussian distributions are shown with dotted black lines. Bottom panel: Distribution of the break frequency in the observed frame for all the sources for which a double power law was favoured. The dotted vertical line is the median value (1.3 GHz). In both panels, the distribution of z > 5 sources is highlighted with filled histograms.
Current usage metrics show cumulative count of Article Views (full-text article views including HTML views, PDF and ePub downloads, according to the available data) and Abstracts Views on Vision4Press platform.
Data correspond to usage on the plateform after 2015. The current usage metrics is available 48-96 hours after online publication and is updated daily on week days.
Initial download of the metrics may take a while.