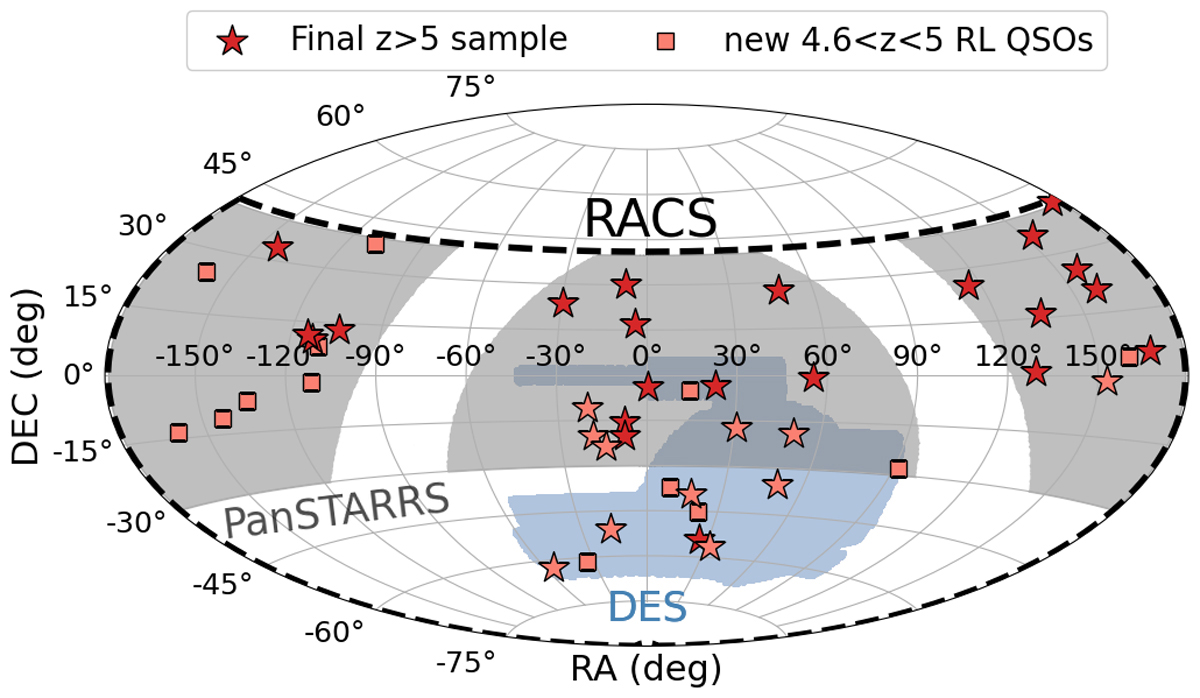
Fig. 1.
Download original image
Sky distribution of the final RACS sample together with the area covered by each optical/NIR survey considered and by the RACS-low survey (delimited by the dashed line). The overall area covers ∼16 000 deg2 at |b|> 15°. The stars indicate the z > 5 sample (darker colour for the quasars already known in the literature and lighter for the new ones reported here), while the squares are the newly discovered sources at 4.5 < z < 5.
Current usage metrics show cumulative count of Article Views (full-text article views including HTML views, PDF and ePub downloads, according to the available data) and Abstracts Views on Vision4Press platform.
Data correspond to usage on the plateform after 2015. The current usage metrics is available 48-96 hours after online publication and is updated daily on week days.
Initial download of the metrics may take a while.