Fig. 9.
Download original image
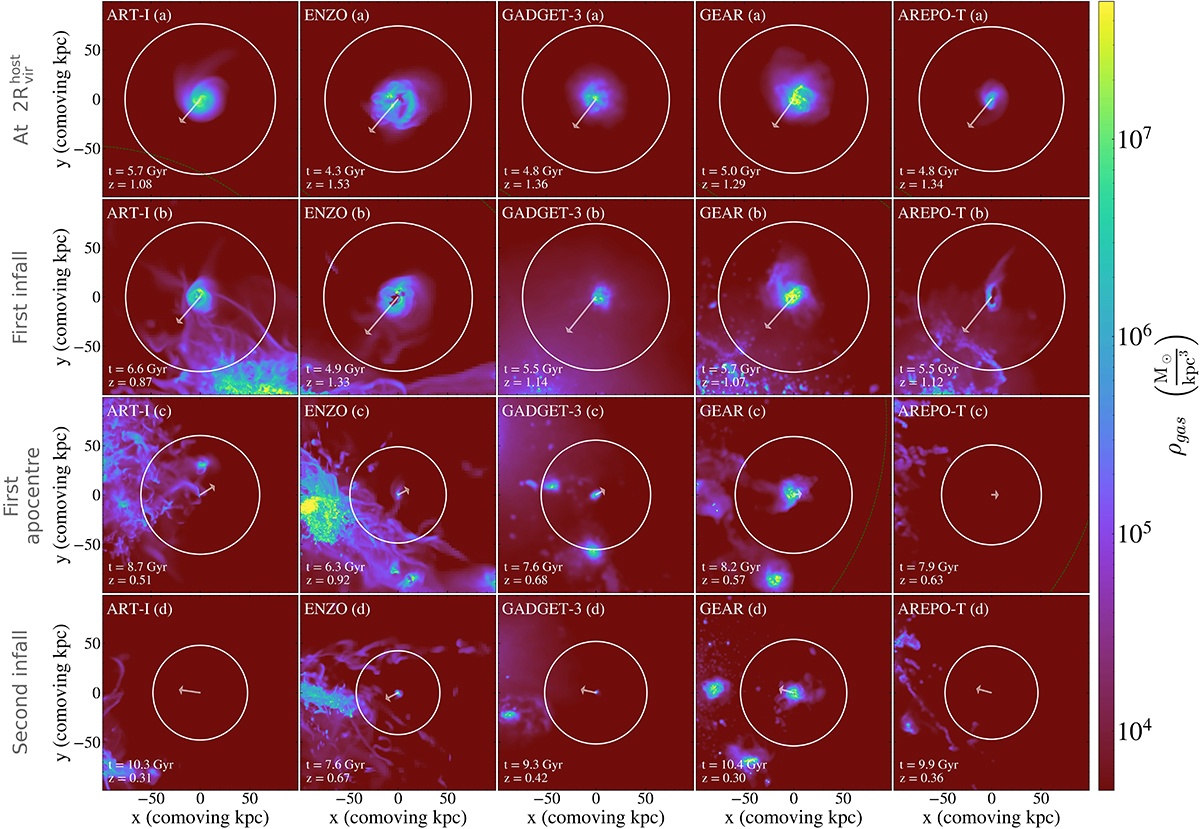
Gas density of the same subhalo across the different models during their infall to the host halo. Gas density is weighted by itself to emphasize the dense regions. Each column represents a different model, while each row indicates the same infall stage. These stages are highlighted in Figure 10: (a) first snapshot at a distance to the host lower than ![]() , (b) at tinfall, (c) during the first apocenter, and (d) during the second infall, slightly before the second pericenter. White solid circle show the subhalo virial radius, while the white arrow provides information about the subhalo's velocity, showing the predicted position of the center of the subhalo in 100 Myr assuming the same velocity as in the current snapshot. An animation showcasing the complete temporal evolution of the subhalo's gas density and temperature during the infall is available online (see footnote 4).
, (b) at tinfall, (c) during the first apocenter, and (d) during the second infall, slightly before the second pericenter. White solid circle show the subhalo virial radius, while the white arrow provides information about the subhalo's velocity, showing the predicted position of the center of the subhalo in 100 Myr assuming the same velocity as in the current snapshot. An animation showcasing the complete temporal evolution of the subhalo's gas density and temperature during the infall is available online (see footnote 4).
Current usage metrics show cumulative count of Article Views (full-text article views including HTML views, PDF and ePub downloads, according to the available data) and Abstracts Views on Vision4Press platform.
Data correspond to usage on the plateform after 2015. The current usage metrics is available 48-96 hours after online publication and is updated daily on week days.
Initial download of the metrics may take a while.